Nigerian vs Yugoslavian Associate's Degree
COMPARE
Nigerian
Yugoslavian
Associate's Degree
Associate's Degree Comparison
Nigerians
Yugoslavians
45.1%
ASSOCIATE'S DEGREE
19.1/ 100
METRIC RATING
204th/ 347
METRIC RANK
46.0%
ASSOCIATE'S DEGREE
40.2/ 100
METRIC RATING
183rd/ 347
METRIC RANK
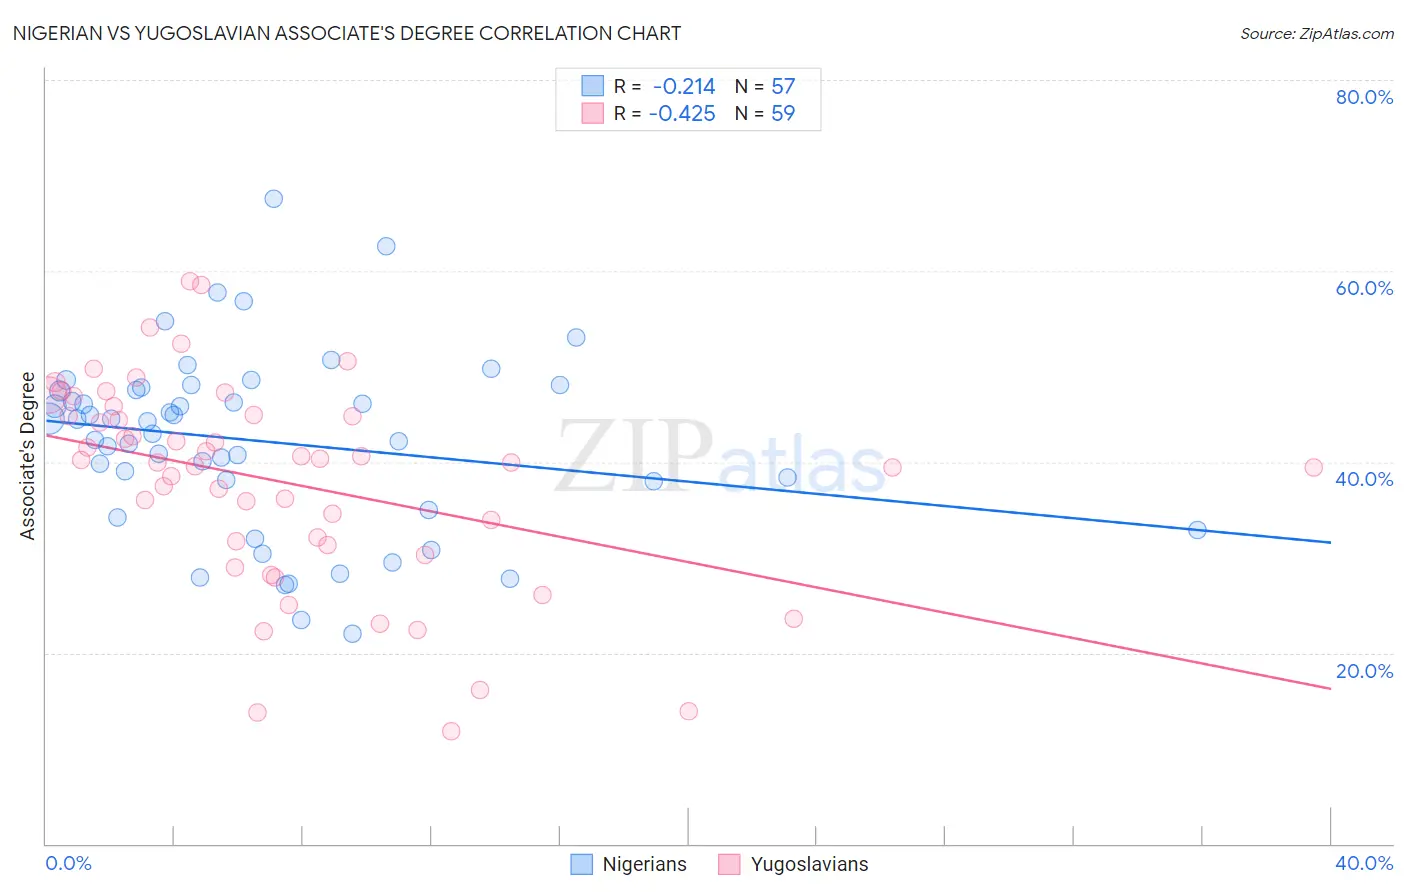
Nigerian vs Yugoslavian Associate's Degree Correlation Chart
The statistical analysis conducted on geographies consisting of 332,751,702 people shows a weak negative correlation between the proportion of Nigerians and percentage of population with at least associate's degree education in the United States with a correlation coefficient (R) of -0.214 and weighted average of 45.1%. Similarly, the statistical analysis conducted on geographies consisting of 285,717,072 people shows a moderate negative correlation between the proportion of Yugoslavians and percentage of population with at least associate's degree education in the United States with a correlation coefficient (R) of -0.425 and weighted average of 46.0%, a difference of 2.0%.
Associate's Degree Correlation Summary
| Measurement | Nigerian | Yugoslavian |
| Minimum | 22.0% | 11.8% |
| Maximum | 67.5% | 58.9% |
| Range | 45.6% | 47.2% |
| Mean | 42.1% | 37.9% |
| Median | 44.3% | 40.0% |
| Interquartile 25% (IQ1) | 36.5% | 31.3% |
| Interquartile 75% (IQ3) | 47.7% | 44.9% |
| Interquartile Range (IQR) | 11.2% | 13.6% |
| Standard Deviation (Sample) | 9.4% | 10.8% |
| Standard Deviation (Population) | 9.4% | 10.7% |
Similar Demographics by Associate's Degree
Demographics Similar to Nigerians by Associate's Degree
In terms of associate's degree, the demographic groups most similar to Nigerians are Immigrants from Thailand (45.1%, a difference of 0.020%), German Russian (45.1%, a difference of 0.030%), Panamanian (45.1%, a difference of 0.090%), Immigrants from South Eastern Asia (45.2%, a difference of 0.14%), and Spaniard (45.2%, a difference of 0.16%).
| Demographics | Rating | Rank | Associate's Degree |
| Scotch-Irish | 22.3 /100 | #197 | Fair 45.3% |
| Immigrants | Bangladesh | 21.3 /100 | #198 | Fair 45.2% |
| Immigrants | Senegal | 21.2 /100 | #199 | Fair 45.2% |
| Senegalese | 21.1 /100 | #200 | Fair 45.2% |
| Immigrants | Vietnam | 20.8 /100 | #201 | Fair 45.2% |
| Spaniards | 20.4 /100 | #202 | Fair 45.2% |
| Immigrants | South Eastern Asia | 20.2 /100 | #203 | Fair 45.2% |
| Nigerians | 19.1 /100 | #204 | Poor 45.1% |
| Immigrants | Thailand | 18.9 /100 | #205 | Poor 45.1% |
| German Russians | 18.9 /100 | #206 | Poor 45.1% |
| Panamanians | 18.4 /100 | #207 | Poor 45.1% |
| Dutch | 17.6 /100 | #208 | Poor 45.0% |
| Immigrants | Costa Rica | 16.7 /100 | #209 | Poor 45.0% |
| Immigrants | Philippines | 16.7 /100 | #210 | Poor 45.0% |
| Immigrants | Zaire | 16.6 /100 | #211 | Poor 45.0% |
Demographics Similar to Yugoslavians by Associate's Degree
In terms of associate's degree, the demographic groups most similar to Yugoslavians are Swiss (46.0%, a difference of 0.010%), Czechoslovakian (46.0%, a difference of 0.020%), Immigrants from Colombia (46.0%, a difference of 0.080%), Costa Rican (46.0%, a difference of 0.13%), and Welsh (45.9%, a difference of 0.19%).
| Demographics | Rating | Rank | Associate's Degree |
| Finns | 48.5 /100 | #176 | Average 46.3% |
| Slovaks | 48.4 /100 | #177 | Average 46.3% |
| Immigrants | Bosnia and Herzegovina | 48.3 /100 | #178 | Average 46.3% |
| Sri Lankans | 47.6 /100 | #179 | Average 46.3% |
| Bermudans | 46.4 /100 | #180 | Average 46.2% |
| Immigrants | Colombia | 41.3 /100 | #181 | Average 46.0% |
| Swiss | 40.4 /100 | #182 | Average 46.0% |
| Yugoslavians | 40.2 /100 | #183 | Average 46.0% |
| Czechoslovakians | 40.0 /100 | #184 | Average 46.0% |
| Costa Ricans | 38.6 /100 | #185 | Fair 46.0% |
| Welsh | 37.9 /100 | #186 | Fair 45.9% |
| Immigrants | Uruguay | 35.5 /100 | #187 | Fair 45.8% |
| Ghanaians | 35.5 /100 | #188 | Fair 45.8% |
| Immigrants | Oceania | 34.7 /100 | #189 | Fair 45.8% |
| Vietnamese | 34.0 /100 | #190 | Fair 45.8% |