Nigerian vs Immigrants from Grenada Associate's Degree
COMPARE
Nigerian
Immigrants from Grenada
Associate's Degree
Associate's Degree Comparison
Nigerians
Immigrants from Grenada
45.1%
ASSOCIATE'S DEGREE
19.1/ 100
METRIC RATING
204th/ 347
METRIC RANK
42.6%
ASSOCIATE'S DEGREE
1.3/ 100
METRIC RATING
239th/ 347
METRIC RANK
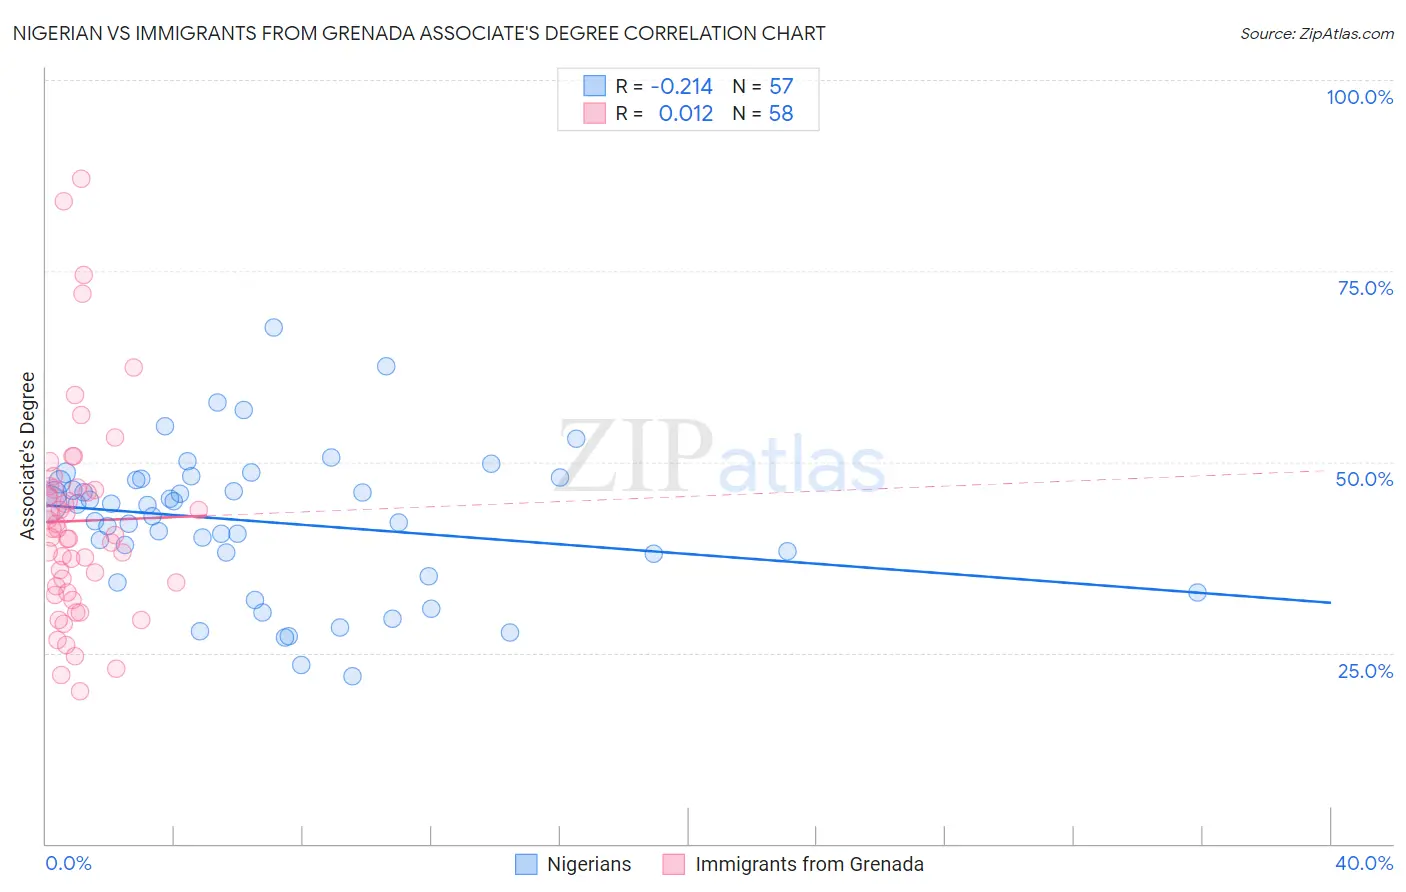
Nigerian vs Immigrants from Grenada Associate's Degree Correlation Chart
The statistical analysis conducted on geographies consisting of 332,751,702 people shows a weak negative correlation between the proportion of Nigerians and percentage of population with at least associate's degree education in the United States with a correlation coefficient (R) of -0.214 and weighted average of 45.1%. Similarly, the statistical analysis conducted on geographies consisting of 67,201,096 people shows no correlation between the proportion of Immigrants from Grenada and percentage of population with at least associate's degree education in the United States with a correlation coefficient (R) of 0.012 and weighted average of 42.6%, a difference of 5.9%.
Associate's Degree Correlation Summary
| Measurement | Nigerian | Immigrants from Grenada |
| Minimum | 22.0% | 20.0% |
| Maximum | 67.5% | 87.1% |
| Range | 45.6% | 67.1% |
| Mean | 42.1% | 42.3% |
| Median | 44.3% | 40.8% |
| Interquartile 25% (IQ1) | 36.5% | 33.8% |
| Interquartile 75% (IQ3) | 47.7% | 46.4% |
| Interquartile Range (IQR) | 11.2% | 12.7% |
| Standard Deviation (Sample) | 9.4% | 13.7% |
| Standard Deviation (Population) | 9.4% | 13.5% |
Similar Demographics by Associate's Degree
Demographics Similar to Nigerians by Associate's Degree
In terms of associate's degree, the demographic groups most similar to Nigerians are Immigrants from Thailand (45.1%, a difference of 0.020%), German Russian (45.1%, a difference of 0.030%), Panamanian (45.1%, a difference of 0.090%), Immigrants from South Eastern Asia (45.2%, a difference of 0.14%), and Spaniard (45.2%, a difference of 0.16%).
| Demographics | Rating | Rank | Associate's Degree |
| Scotch-Irish | 22.3 /100 | #197 | Fair 45.3% |
| Immigrants | Bangladesh | 21.3 /100 | #198 | Fair 45.2% |
| Immigrants | Senegal | 21.2 /100 | #199 | Fair 45.2% |
| Senegalese | 21.1 /100 | #200 | Fair 45.2% |
| Immigrants | Vietnam | 20.8 /100 | #201 | Fair 45.2% |
| Spaniards | 20.4 /100 | #202 | Fair 45.2% |
| Immigrants | South Eastern Asia | 20.2 /100 | #203 | Fair 45.2% |
| Nigerians | 19.1 /100 | #204 | Poor 45.1% |
| Immigrants | Thailand | 18.9 /100 | #205 | Poor 45.1% |
| German Russians | 18.9 /100 | #206 | Poor 45.1% |
| Panamanians | 18.4 /100 | #207 | Poor 45.1% |
| Dutch | 17.6 /100 | #208 | Poor 45.0% |
| Immigrants | Costa Rica | 16.7 /100 | #209 | Poor 45.0% |
| Immigrants | Philippines | 16.7 /100 | #210 | Poor 45.0% |
| Immigrants | Zaire | 16.6 /100 | #211 | Poor 45.0% |
Demographics Similar to Immigrants from Grenada by Associate's Degree
In terms of associate's degree, the demographic groups most similar to Immigrants from Grenada are Cree (42.5%, a difference of 0.18%), Iroquois (42.8%, a difference of 0.51%), British West Indian (42.4%, a difference of 0.51%), Immigrants from West Indies (42.4%, a difference of 0.52%), and Guyanese (42.3%, a difference of 0.64%).
| Demographics | Rating | Rank | Associate's Degree |
| Native Hawaiians | 2.3 /100 | #232 | Tragic 43.1% |
| Tongans | 2.2 /100 | #233 | Tragic 43.0% |
| Tlingit-Haida | 2.1 /100 | #234 | Tragic 43.0% |
| Ecuadorians | 2.0 /100 | #235 | Tragic 43.0% |
| Immigrants | St. Vincent and the Grenadines | 1.9 /100 | #236 | Tragic 42.9% |
| Immigrants | Nonimmigrants | 1.9 /100 | #237 | Tragic 42.9% |
| Iroquois | 1.7 /100 | #238 | Tragic 42.8% |
| Immigrants | Grenada | 1.3 /100 | #239 | Tragic 42.6% |
| Cree | 1.2 /100 | #240 | Tragic 42.5% |
| British West Indians | 1.0 /100 | #241 | Tragic 42.4% |
| Immigrants | West Indies | 1.0 /100 | #242 | Tragic 42.4% |
| Guyanese | 1.0 /100 | #243 | Tragic 42.3% |
| Immigrants | Liberia | 0.9 /100 | #244 | Tragic 42.3% |
| Immigrants | Cambodia | 0.9 /100 | #245 | Tragic 42.3% |
| Delaware | 0.9 /100 | #246 | Tragic 42.3% |