New Zealander vs Immigrants from Nicaragua College, 1 year or more
COMPARE
New Zealander
Immigrants from Nicaragua
College, 1 year or more
College, 1 year or more Comparison
New Zealanders
Immigrants from Nicaragua
64.6%
COLLEGE, 1 YEAR OR MORE
99.9/ 100
METRIC RATING
49th/ 347
METRIC RANK
52.4%
COLLEGE, 1 YEAR OR MORE
0.0/ 100
METRIC RATING
299th/ 347
METRIC RANK
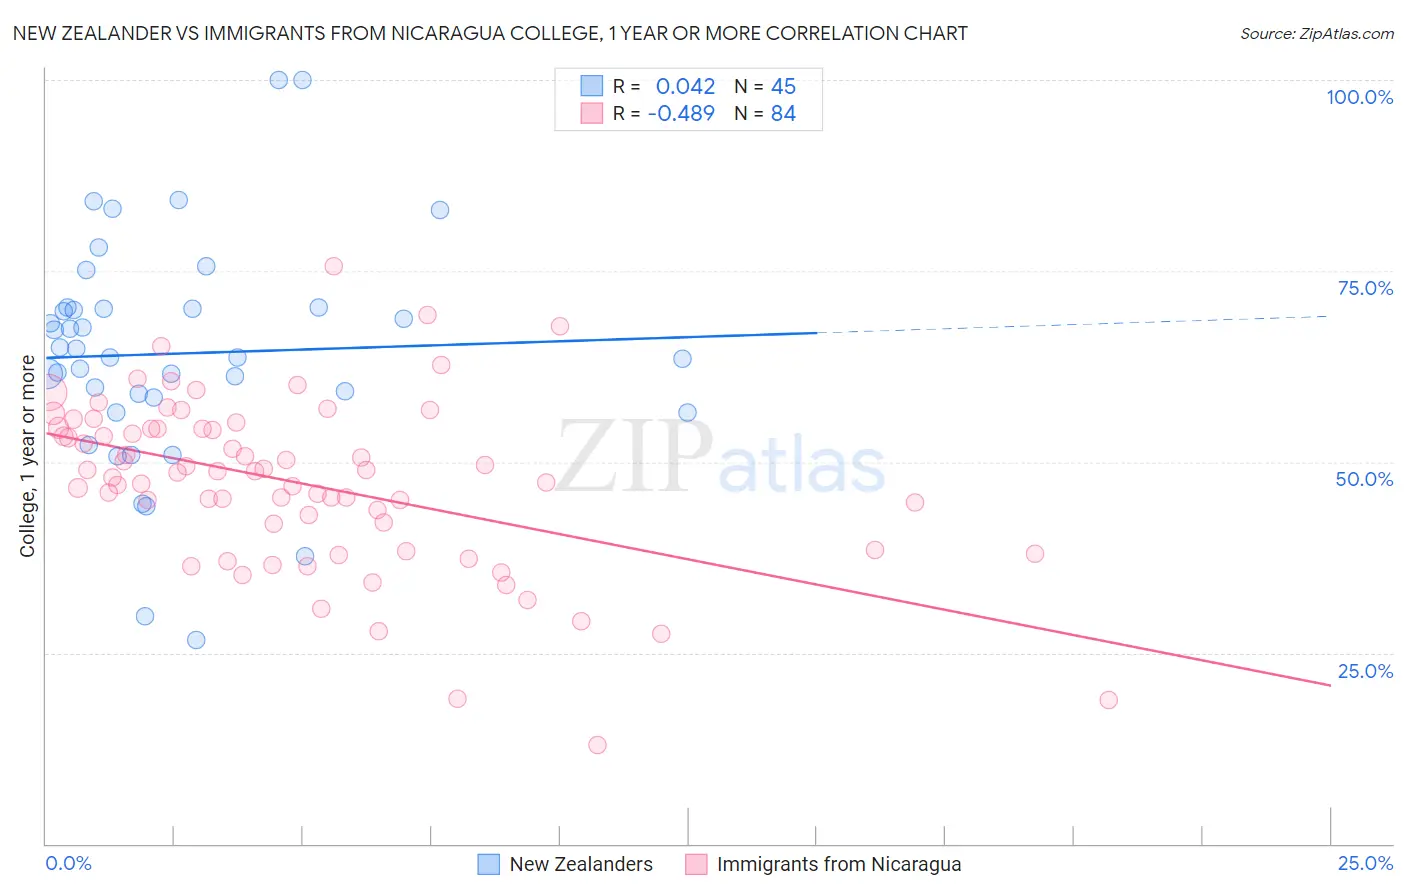
New Zealander vs Immigrants from Nicaragua College, 1 year or more Correlation Chart
The statistical analysis conducted on geographies consisting of 106,918,889 people shows no correlation between the proportion of New Zealanders and percentage of population with at least college, 1 year or more education in the United States with a correlation coefficient (R) of 0.042 and weighted average of 64.6%. Similarly, the statistical analysis conducted on geographies consisting of 236,341,850 people shows a moderate negative correlation between the proportion of Immigrants from Nicaragua and percentage of population with at least college, 1 year or more education in the United States with a correlation coefficient (R) of -0.489 and weighted average of 52.4%, a difference of 23.3%.
College, 1 year or more Correlation Summary
| Measurement | New Zealander | Immigrants from Nicaragua |
| Minimum | 26.7% | 13.0% |
| Maximum | 100.0% | 75.6% |
| Range | 73.3% | 62.6% |
| Mean | 64.2% | 47.2% |
| Median | 63.6% | 48.6% |
| Interquartile 25% (IQ1) | 57.4% | 40.2% |
| Interquartile 75% (IQ3) | 70.1% | 54.4% |
| Interquartile Range (IQR) | 12.7% | 14.2% |
| Standard Deviation (Sample) | 14.9% | 11.2% |
| Standard Deviation (Population) | 14.8% | 11.1% |
Similar Demographics by College, 1 year or more
Demographics Similar to New Zealanders by College, 1 year or more
In terms of college, 1 year or more, the demographic groups most similar to New Zealanders are Immigrants from Bulgaria (64.6%, a difference of 0.040%), Bhutanese (64.6%, a difference of 0.070%), Australian (64.6%, a difference of 0.070%), Immigrants from Lithuania (64.6%, a difference of 0.080%), and Immigrants from Norway (64.7%, a difference of 0.25%).
| Demographics | Rating | Rank | College, 1 year or more |
| Immigrants | Latvia | 99.9 /100 | #42 | Exceptional 64.8% |
| Immigrants | Russia | 99.9 /100 | #43 | Exceptional 64.7% |
| Immigrants | Norway | 99.9 /100 | #44 | Exceptional 64.7% |
| Immigrants | Lithuania | 99.9 /100 | #45 | Exceptional 64.6% |
| Bhutanese | 99.9 /100 | #46 | Exceptional 64.6% |
| Australians | 99.9 /100 | #47 | Exceptional 64.6% |
| Immigrants | Bulgaria | 99.9 /100 | #48 | Exceptional 64.6% |
| New Zealanders | 99.9 /100 | #49 | Exceptional 64.6% |
| Immigrants | Austria | 99.8 /100 | #50 | Exceptional 64.4% |
| Immigrants | Malaysia | 99.8 /100 | #51 | Exceptional 64.3% |
| Immigrants | Netherlands | 99.8 /100 | #52 | Exceptional 64.2% |
| Asians | 99.8 /100 | #53 | Exceptional 64.2% |
| Zimbabweans | 99.8 /100 | #54 | Exceptional 64.2% |
| Immigrants | Belarus | 99.7 /100 | #55 | Exceptional 64.1% |
| Immigrants | Czechoslovakia | 99.7 /100 | #56 | Exceptional 64.1% |
Demographics Similar to Immigrants from Nicaragua by College, 1 year or more
In terms of college, 1 year or more, the demographic groups most similar to Immigrants from Nicaragua are Choctaw (52.3%, a difference of 0.040%), Haitian (52.3%, a difference of 0.10%), Puerto Rican (52.2%, a difference of 0.23%), Creek (52.2%, a difference of 0.30%), and Immigrants from Dominica (52.5%, a difference of 0.34%).
| Demographics | Rating | Rank | College, 1 year or more |
| Chickasaw | 0.0 /100 | #292 | Tragic 53.3% |
| Blacks/African Americans | 0.0 /100 | #293 | Tragic 53.3% |
| Cherokee | 0.0 /100 | #294 | Tragic 53.2% |
| Yaqui | 0.0 /100 | #295 | Tragic 53.2% |
| Sioux | 0.0 /100 | #296 | Tragic 53.0% |
| Paiute | 0.0 /100 | #297 | Tragic 52.9% |
| Immigrants | Dominica | 0.0 /100 | #298 | Tragic 52.5% |
| Immigrants | Nicaragua | 0.0 /100 | #299 | Tragic 52.4% |
| Choctaw | 0.0 /100 | #300 | Tragic 52.3% |
| Haitians | 0.0 /100 | #301 | Tragic 52.3% |
| Puerto Ricans | 0.0 /100 | #302 | Tragic 52.2% |
| Creek | 0.0 /100 | #303 | Tragic 52.2% |
| Central Americans | 0.0 /100 | #304 | Tragic 52.1% |
| Seminole | 0.0 /100 | #305 | Tragic 52.1% |
| Mexican American Indians | 0.0 /100 | #306 | Tragic 51.9% |