New Zealander vs French Canadian College, 1 year or more
COMPARE
New Zealander
French Canadian
College, 1 year or more
College, 1 year or more Comparison
New Zealanders
French Canadians
64.6%
COLLEGE, 1 YEAR OR MORE
99.9/ 100
METRIC RATING
49th/ 347
METRIC RANK
57.8%
COLLEGE, 1 YEAR OR MORE
11.8/ 100
METRIC RATING
213th/ 347
METRIC RANK
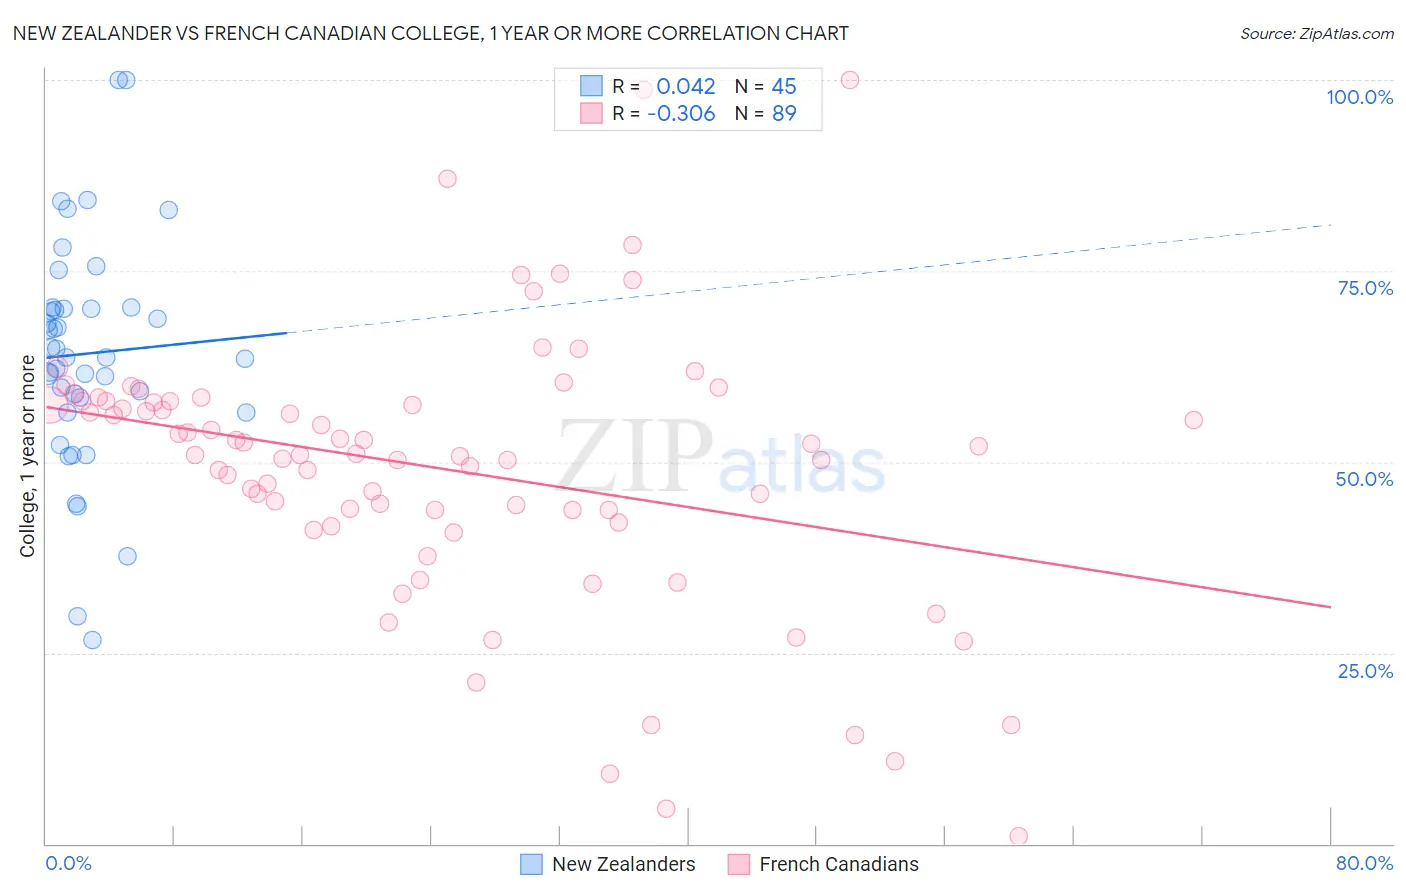
New Zealander vs French Canadian College, 1 year or more Correlation Chart
The statistical analysis conducted on geographies consisting of 106,918,889 people shows no correlation between the proportion of New Zealanders and percentage of population with at least college, 1 year or more education in the United States with a correlation coefficient (R) of 0.042 and weighted average of 64.6%. Similarly, the statistical analysis conducted on geographies consisting of 502,674,122 people shows a mild negative correlation between the proportion of French Canadians and percentage of population with at least college, 1 year or more education in the United States with a correlation coefficient (R) of -0.306 and weighted average of 57.8%, a difference of 11.6%.
College, 1 year or more Correlation Summary
| Measurement | New Zealander | French Canadian |
| Minimum | 26.7% | 0.95% |
| Maximum | 100.0% | 100.0% |
| Range | 73.3% | 99.0% |
| Mean | 64.2% | 49.1% |
| Median | 63.6% | 51.0% |
| Interquartile 25% (IQ1) | 57.4% | 42.9% |
| Interquartile 75% (IQ3) | 70.1% | 57.9% |
| Interquartile Range (IQR) | 12.7% | 15.0% |
| Standard Deviation (Sample) | 14.9% | 17.8% |
| Standard Deviation (Population) | 14.8% | 17.7% |
Similar Demographics by College, 1 year or more
Demographics Similar to New Zealanders by College, 1 year or more
In terms of college, 1 year or more, the demographic groups most similar to New Zealanders are Immigrants from Bulgaria (64.6%, a difference of 0.040%), Bhutanese (64.6%, a difference of 0.070%), Australian (64.6%, a difference of 0.070%), Immigrants from Lithuania (64.6%, a difference of 0.080%), and Immigrants from Norway (64.7%, a difference of 0.25%).
| Demographics | Rating | Rank | College, 1 year or more |
| Immigrants | Latvia | 99.9 /100 | #42 | Exceptional 64.8% |
| Immigrants | Russia | 99.9 /100 | #43 | Exceptional 64.7% |
| Immigrants | Norway | 99.9 /100 | #44 | Exceptional 64.7% |
| Immigrants | Lithuania | 99.9 /100 | #45 | Exceptional 64.6% |
| Bhutanese | 99.9 /100 | #46 | Exceptional 64.6% |
| Australians | 99.9 /100 | #47 | Exceptional 64.6% |
| Immigrants | Bulgaria | 99.9 /100 | #48 | Exceptional 64.6% |
| New Zealanders | 99.9 /100 | #49 | Exceptional 64.6% |
| Immigrants | Austria | 99.8 /100 | #50 | Exceptional 64.4% |
| Immigrants | Malaysia | 99.8 /100 | #51 | Exceptional 64.3% |
| Immigrants | Netherlands | 99.8 /100 | #52 | Exceptional 64.2% |
| Asians | 99.8 /100 | #53 | Exceptional 64.2% |
| Zimbabweans | 99.8 /100 | #54 | Exceptional 64.2% |
| Immigrants | Belarus | 99.7 /100 | #55 | Exceptional 64.1% |
| Immigrants | Czechoslovakia | 99.7 /100 | #56 | Exceptional 64.1% |
Demographics Similar to French Canadians by College, 1 year or more
In terms of college, 1 year or more, the demographic groups most similar to French Canadians are Immigrants from Senegal (57.8%, a difference of 0.0%), Immigrants from Colombia (57.8%, a difference of 0.030%), Tongan (57.8%, a difference of 0.040%), Immigrants from Peru (57.7%, a difference of 0.17%), and Immigrants from Nigeria (57.9%, a difference of 0.18%).
| Demographics | Rating | Rank | College, 1 year or more |
| Immigrants | Vietnam | 18.2 /100 | #206 | Poor 58.2% |
| Senegalese | 16.9 /100 | #207 | Poor 58.2% |
| Immigrants | Uruguay | 15.2 /100 | #208 | Poor 58.1% |
| Immigrants | Middle Africa | 14.0 /100 | #209 | Poor 58.0% |
| Tsimshian | 13.5 /100 | #210 | Poor 57.9% |
| Immigrants | Nigeria | 13.3 /100 | #211 | Poor 57.9% |
| Immigrants | Senegal | 11.8 /100 | #212 | Poor 57.8% |
| French Canadians | 11.8 /100 | #213 | Poor 57.8% |
| Immigrants | Colombia | 11.6 /100 | #214 | Poor 57.8% |
| Tongans | 11.6 /100 | #215 | Poor 57.8% |
| Immigrants | Peru | 10.6 /100 | #216 | Poor 57.7% |
| Immigrants | Panama | 9.1 /100 | #217 | Tragic 57.6% |
| Native Hawaiians | 9.0 /100 | #218 | Tragic 57.6% |
| Whites/Caucasians | 8.7 /100 | #219 | Tragic 57.6% |
| Immigrants | Costa Rica | 8.0 /100 | #220 | Tragic 57.5% |