New Zealander vs Immigrants from Burma/Myanmar Professional Degree
COMPARE
New Zealander
Immigrants from Burma/Myanmar
Professional Degree
Professional Degree Comparison
New Zealanders
Immigrants from Burma/Myanmar
6.0%
PROFESSIONAL DEGREE
100.0/ 100
METRIC RATING
41st/ 347
METRIC RANK
3.9%
PROFESSIONAL DEGREE
5.4/ 100
METRIC RATING
229th/ 347
METRIC RANK
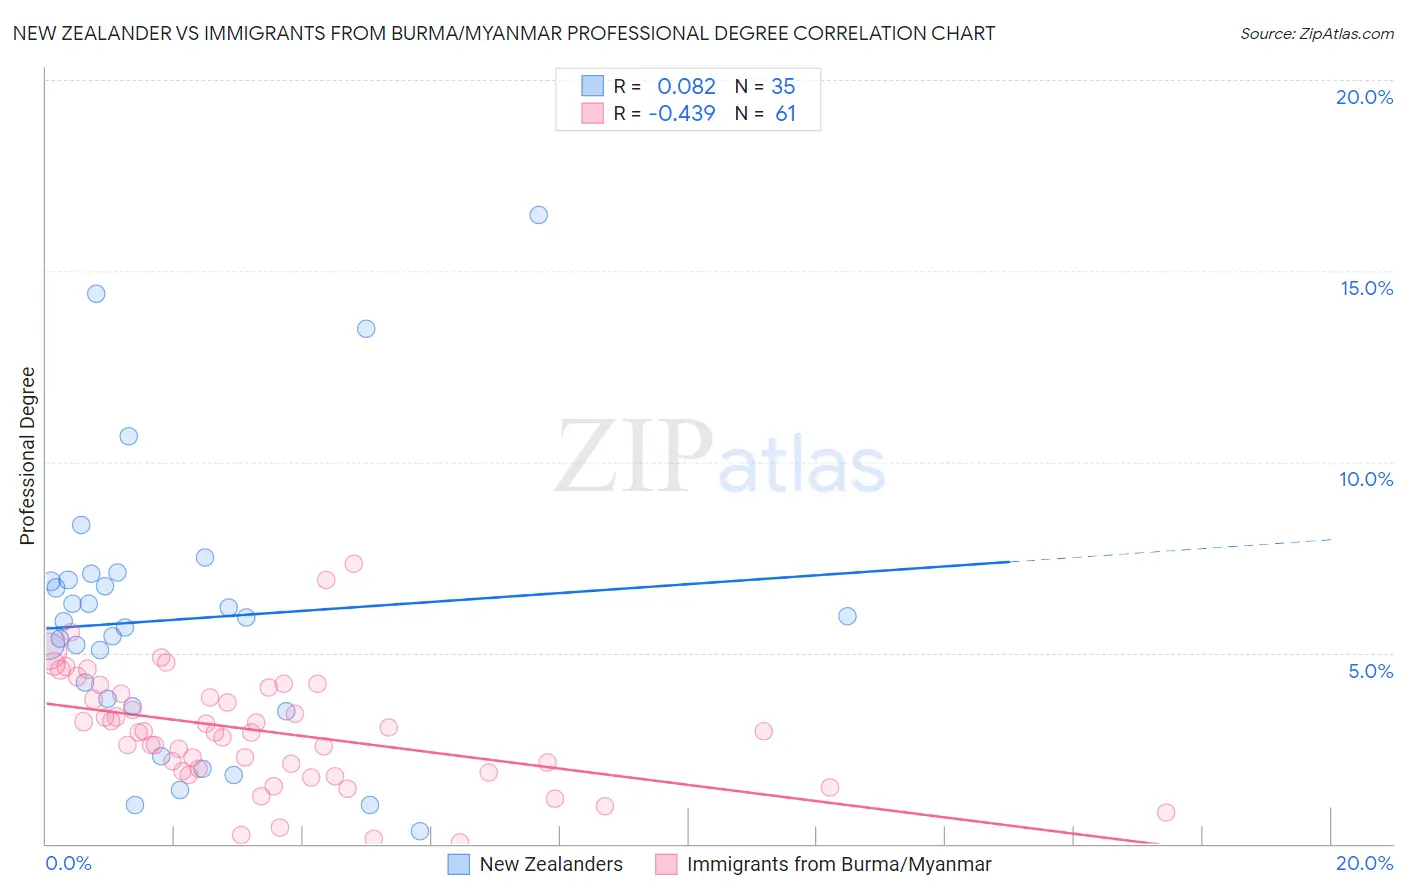
New Zealander vs Immigrants from Burma/Myanmar Professional Degree Correlation Chart
The statistical analysis conducted on geographies consisting of 106,863,101 people shows a slight positive correlation between the proportion of New Zealanders and percentage of population with at least professional degree education in the United States with a correlation coefficient (R) of 0.082 and weighted average of 6.0%. Similarly, the statistical analysis conducted on geographies consisting of 172,191,729 people shows a moderate negative correlation between the proportion of Immigrants from Burma/Myanmar and percentage of population with at least professional degree education in the United States with a correlation coefficient (R) of -0.439 and weighted average of 3.9%, a difference of 50.8%.
Professional Degree Correlation Summary
| Measurement | New Zealander | Immigrants from Burma/Myanmar |
| Minimum | 0.31% | 0.034% |
| Maximum | 16.5% | 7.3% |
| Range | 16.1% | 7.3% |
| Mean | 5.9% | 3.0% |
| Median | 5.8% | 2.9% |
| Interquartile 25% (IQ1) | 3.6% | 1.9% |
| Interquartile 75% (IQ3) | 6.9% | 4.0% |
| Interquartile Range (IQR) | 3.3% | 2.1% |
| Standard Deviation (Sample) | 3.6% | 1.5% |
| Standard Deviation (Population) | 3.6% | 1.5% |
Similar Demographics by Professional Degree
Demographics Similar to New Zealanders by Professional Degree
In terms of professional degree, the demographic groups most similar to New Zealanders are Estonian (6.0%, a difference of 0.010%), Cambodian (6.0%, a difference of 0.18%), Immigrants from Saudi Arabia (5.9%, a difference of 0.33%), Argentinean (5.9%, a difference of 0.49%), and Immigrants from South Africa (6.0%, a difference of 0.66%).
| Demographics | Rating | Rank | Professional Degree |
| Mongolians | 100.0 /100 | #34 | Exceptional 6.1% |
| Immigrants | Korea | 100.0 /100 | #35 | Exceptional 6.1% |
| Immigrants | Russia | 100.0 /100 | #36 | Exceptional 6.0% |
| Immigrants | Austria | 100.0 /100 | #37 | Exceptional 6.0% |
| Immigrants | Norway | 100.0 /100 | #38 | Exceptional 6.0% |
| Immigrants | South Africa | 100.0 /100 | #39 | Exceptional 6.0% |
| Cambodians | 100.0 /100 | #40 | Exceptional 6.0% |
| New Zealanders | 100.0 /100 | #41 | Exceptional 6.0% |
| Estonians | 100.0 /100 | #42 | Exceptional 6.0% |
| Immigrants | Saudi Arabia | 100.0 /100 | #43 | Exceptional 5.9% |
| Argentineans | 100.0 /100 | #44 | Exceptional 5.9% |
| Immigrants | South Central Asia | 100.0 /100 | #45 | Exceptional 5.9% |
| Immigrants | Argentina | 100.0 /100 | #46 | Exceptional 5.9% |
| Australians | 100.0 /100 | #47 | Exceptional 5.9% |
| Paraguayans | 100.0 /100 | #48 | Exceptional 5.9% |
Demographics Similar to Immigrants from Burma/Myanmar by Professional Degree
In terms of professional degree, the demographic groups most similar to Immigrants from Burma/Myanmar are Immigrants from West Indies (4.0%, a difference of 0.14%), Nicaraguan (3.9%, a difference of 0.27%), Cuban (4.0%, a difference of 0.39%), German Russian (4.0%, a difference of 0.52%), and Ecuadorian (3.9%, a difference of 0.73%).
| Demographics | Rating | Rank | Professional Degree |
| Immigrants | Western Africa | 7.5 /100 | #222 | Tragic 4.0% |
| Immigrants | Bosnia and Herzegovina | 7.4 /100 | #223 | Tragic 4.0% |
| Trinidadians and Tobagonians | 7.1 /100 | #224 | Tragic 4.0% |
| Tlingit-Haida | 6.9 /100 | #225 | Tragic 4.0% |
| German Russians | 6.1 /100 | #226 | Tragic 4.0% |
| Cubans | 5.9 /100 | #227 | Tragic 4.0% |
| Immigrants | West Indies | 5.6 /100 | #228 | Tragic 4.0% |
| Immigrants | Burma/Myanmar | 5.4 /100 | #229 | Tragic 3.9% |
| Nicaraguans | 5.1 /100 | #230 | Tragic 3.9% |
| Ecuadorians | 4.6 /100 | #231 | Tragic 3.9% |
| Cree | 4.3 /100 | #232 | Tragic 3.9% |
| Immigrants | Philippines | 4.1 /100 | #233 | Tragic 3.9% |
| Immigrants | Nonimmigrants | 4.0 /100 | #234 | Tragic 3.9% |
| Immigrants | Barbados | 4.0 /100 | #235 | Tragic 3.9% |
| Spanish Americans | 3.8 /100 | #236 | Tragic 3.9% |