Nepalese vs Immigrants from Poland Professional Degree
COMPARE
Nepalese
Immigrants from Poland
Professional Degree
Professional Degree Comparison
Nepalese
Immigrants from Poland
3.2%
PROFESSIONAL DEGREE
0.1/ 100
METRIC RATING
317th/ 347
METRIC RANK
4.3%
PROFESSIONAL DEGREE
29.2/ 100
METRIC RATING
190th/ 347
METRIC RANK
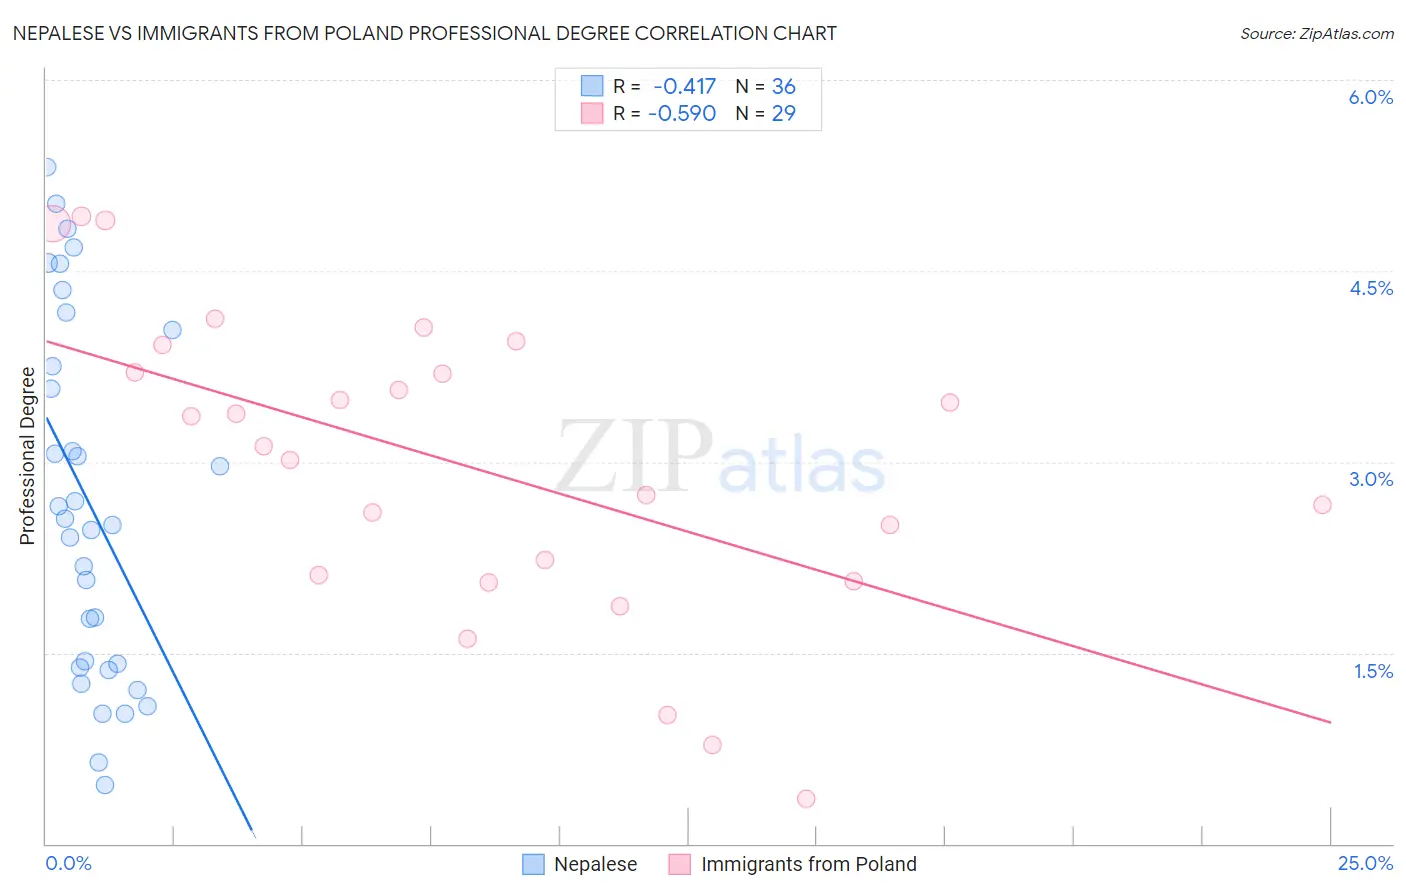
Nepalese vs Immigrants from Poland Professional Degree Correlation Chart
The statistical analysis conducted on geographies consisting of 24,504,313 people shows a moderate negative correlation between the proportion of Nepalese and percentage of population with at least professional degree education in the United States with a correlation coefficient (R) of -0.417 and weighted average of 3.2%. Similarly, the statistical analysis conducted on geographies consisting of 304,504,967 people shows a substantial negative correlation between the proportion of Immigrants from Poland and percentage of population with at least professional degree education in the United States with a correlation coefficient (R) of -0.590 and weighted average of 4.3%, a difference of 31.7%.
Professional Degree Correlation Summary
| Measurement | Nepalese | Immigrants from Poland |
| Minimum | 0.47% | 0.35% |
| Maximum | 5.3% | 4.9% |
| Range | 4.9% | 4.6% |
| Mean | 2.7% | 3.0% |
| Median | 2.5% | 3.1% |
| Interquartile 25% (IQ1) | 1.4% | 2.1% |
| Interquartile 75% (IQ3) | 3.9% | 3.8% |
| Interquartile Range (IQR) | 2.5% | 1.7% |
| Standard Deviation (Sample) | 1.4% | 1.2% |
| Standard Deviation (Population) | 1.4% | 1.2% |
Similar Demographics by Professional Degree
Demographics Similar to Nepalese by Professional Degree
In terms of professional degree, the demographic groups most similar to Nepalese are Immigrants from Micronesia (3.2%, a difference of 0.030%), Puerto Rican (3.2%, a difference of 0.21%), Immigrants from Laos (3.2%, a difference of 0.22%), Choctaw (3.2%, a difference of 0.27%), and Mexican American Indian (3.3%, a difference of 0.90%).
| Demographics | Rating | Rank | Professional Degree |
| Immigrants | Latin America | 0.1 /100 | #310 | Tragic 3.3% |
| Cherokee | 0.1 /100 | #311 | Tragic 3.3% |
| Sioux | 0.1 /100 | #312 | Tragic 3.3% |
| Yuman | 0.1 /100 | #313 | Tragic 3.3% |
| Mexican American Indians | 0.1 /100 | #314 | Tragic 3.3% |
| Immigrants | Laos | 0.1 /100 | #315 | Tragic 3.2% |
| Puerto Ricans | 0.1 /100 | #316 | Tragic 3.2% |
| Nepalese | 0.1 /100 | #317 | Tragic 3.2% |
| Immigrants | Micronesia | 0.1 /100 | #318 | Tragic 3.2% |
| Choctaw | 0.1 /100 | #319 | Tragic 3.2% |
| Seminole | 0.1 /100 | #320 | Tragic 3.2% |
| Tsimshian | 0.0 /100 | #321 | Tragic 3.2% |
| Hispanics or Latinos | 0.0 /100 | #322 | Tragic 3.2% |
| Inupiat | 0.0 /100 | #323 | Tragic 3.2% |
| Crow | 0.0 /100 | #324 | Tragic 3.2% |
Demographics Similar to Immigrants from Poland by Professional Degree
In terms of professional degree, the demographic groups most similar to Immigrants from Poland are Sri Lankan (4.3%, a difference of 0.040%), Slovak (4.3%, a difference of 0.26%), Ghanaian (4.3%, a difference of 0.36%), French (4.2%, a difference of 0.40%), and Immigrants from Thailand (4.3%, a difference of 0.44%).
| Demographics | Rating | Rank | Professional Degree |
| Bermudans | 43.1 /100 | #183 | Average 4.4% |
| Belgians | 36.2 /100 | #184 | Fair 4.3% |
| Welsh | 35.8 /100 | #185 | Fair 4.3% |
| Scotch-Irish | 34.2 /100 | #186 | Fair 4.3% |
| Immigrants | Cameroon | 33.3 /100 | #187 | Fair 4.3% |
| Immigrants | Thailand | 31.7 /100 | #188 | Fair 4.3% |
| Slovaks | 30.7 /100 | #189 | Fair 4.3% |
| Immigrants | Poland | 29.2 /100 | #190 | Fair 4.3% |
| Sri Lankans | 29.0 /100 | #191 | Fair 4.3% |
| Ghanaians | 27.3 /100 | #192 | Fair 4.3% |
| French | 27.1 /100 | #193 | Fair 4.2% |
| Scandinavians | 25.8 /100 | #194 | Fair 4.2% |
| Nigerians | 24.6 /100 | #195 | Fair 4.2% |
| Spanish | 23.0 /100 | #196 | Fair 4.2% |
| Czechoslovakians | 22.4 /100 | #197 | Fair 4.2% |