Nepalese vs Immigrants from Barbados Professional Degree
COMPARE
Nepalese
Immigrants from Barbados
Professional Degree
Professional Degree Comparison
Nepalese
Immigrants from Barbados
3.2%
PROFESSIONAL DEGREE
0.1/ 100
METRIC RATING
317th/ 347
METRIC RANK
3.9%
PROFESSIONAL DEGREE
4.0/ 100
METRIC RATING
235th/ 347
METRIC RANK
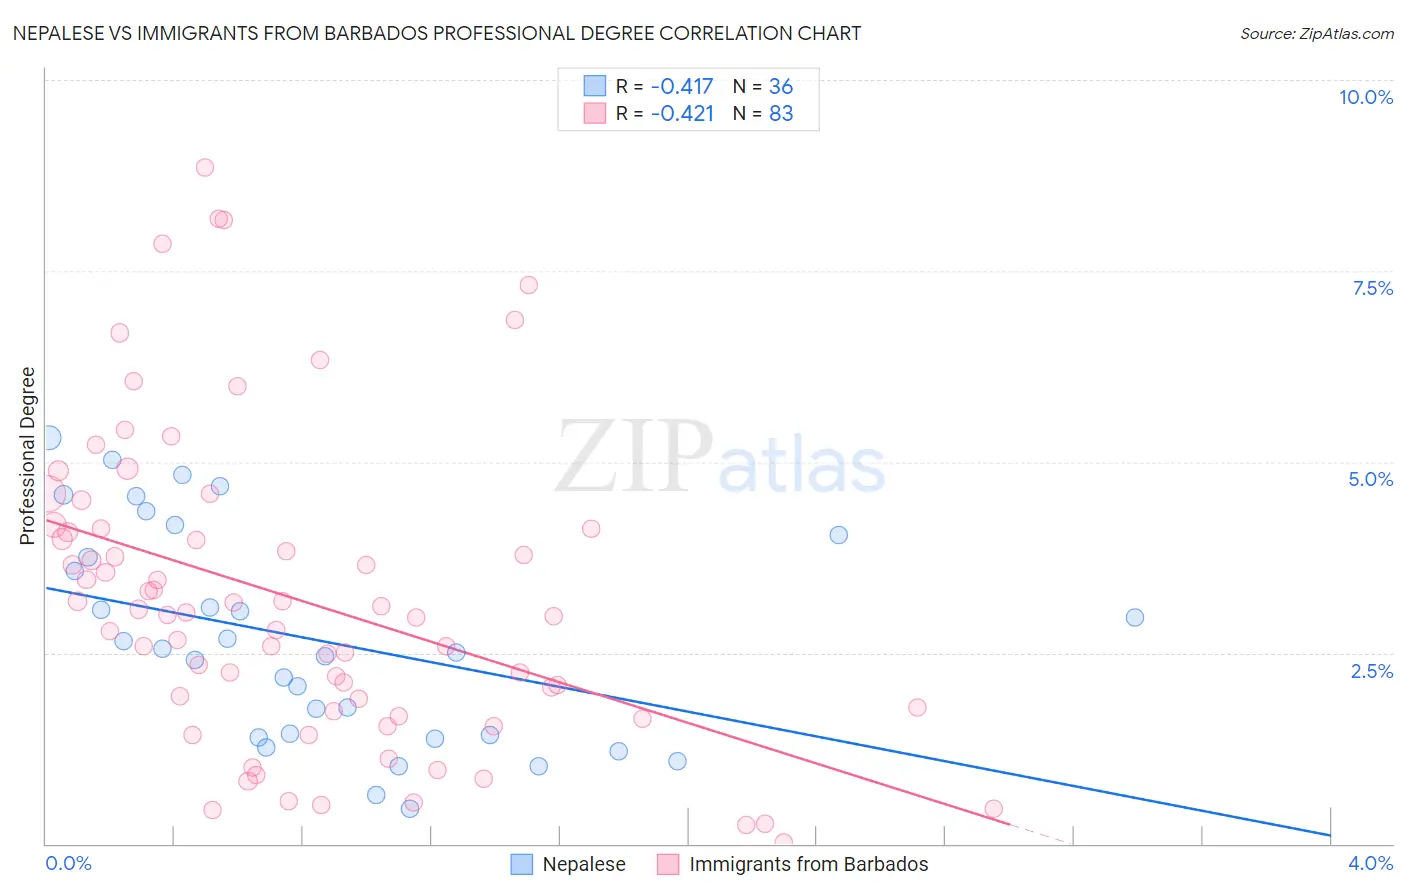
Nepalese vs Immigrants from Barbados Professional Degree Correlation Chart
The statistical analysis conducted on geographies consisting of 24,504,313 people shows a moderate negative correlation between the proportion of Nepalese and percentage of population with at least professional degree education in the United States with a correlation coefficient (R) of -0.417 and weighted average of 3.2%. Similarly, the statistical analysis conducted on geographies consisting of 112,711,705 people shows a moderate negative correlation between the proportion of Immigrants from Barbados and percentage of population with at least professional degree education in the United States with a correlation coefficient (R) of -0.421 and weighted average of 3.9%, a difference of 20.4%.
Professional Degree Correlation Summary
| Measurement | Nepalese | Immigrants from Barbados |
| Minimum | 0.47% | 0.017% |
| Maximum | 5.3% | 8.9% |
| Range | 4.9% | 8.8% |
| Mean | 2.7% | 3.2% |
| Median | 2.5% | 3.0% |
| Interquartile 25% (IQ1) | 1.4% | 1.7% |
| Interquartile 75% (IQ3) | 3.9% | 4.1% |
| Interquartile Range (IQR) | 2.5% | 2.4% |
| Standard Deviation (Sample) | 1.4% | 2.0% |
| Standard Deviation (Population) | 1.4% | 2.0% |
Similar Demographics by Professional Degree
Demographics Similar to Nepalese by Professional Degree
In terms of professional degree, the demographic groups most similar to Nepalese are Immigrants from Micronesia (3.2%, a difference of 0.030%), Puerto Rican (3.2%, a difference of 0.21%), Immigrants from Laos (3.2%, a difference of 0.22%), Choctaw (3.2%, a difference of 0.27%), and Mexican American Indian (3.3%, a difference of 0.90%).
| Demographics | Rating | Rank | Professional Degree |
| Immigrants | Latin America | 0.1 /100 | #310 | Tragic 3.3% |
| Cherokee | 0.1 /100 | #311 | Tragic 3.3% |
| Sioux | 0.1 /100 | #312 | Tragic 3.3% |
| Yuman | 0.1 /100 | #313 | Tragic 3.3% |
| Mexican American Indians | 0.1 /100 | #314 | Tragic 3.3% |
| Immigrants | Laos | 0.1 /100 | #315 | Tragic 3.2% |
| Puerto Ricans | 0.1 /100 | #316 | Tragic 3.2% |
| Nepalese | 0.1 /100 | #317 | Tragic 3.2% |
| Immigrants | Micronesia | 0.1 /100 | #318 | Tragic 3.2% |
| Choctaw | 0.1 /100 | #319 | Tragic 3.2% |
| Seminole | 0.1 /100 | #320 | Tragic 3.2% |
| Tsimshian | 0.0 /100 | #321 | Tragic 3.2% |
| Hispanics or Latinos | 0.0 /100 | #322 | Tragic 3.2% |
| Inupiat | 0.0 /100 | #323 | Tragic 3.2% |
| Crow | 0.0 /100 | #324 | Tragic 3.2% |
Demographics Similar to Immigrants from Barbados by Professional Degree
In terms of professional degree, the demographic groups most similar to Immigrants from Barbados are Nonimmigrants (3.9%, a difference of 0.010%), Immigrants from Philippines (3.9%, a difference of 0.050%), Spanish American (3.9%, a difference of 0.22%), Immigrants from Trinidad and Tobago (3.9%, a difference of 0.29%), and Cree (3.9%, a difference of 0.31%).
| Demographics | Rating | Rank | Professional Degree |
| Immigrants | West Indies | 5.6 /100 | #228 | Tragic 4.0% |
| Immigrants | Burma/Myanmar | 5.4 /100 | #229 | Tragic 3.9% |
| Nicaraguans | 5.1 /100 | #230 | Tragic 3.9% |
| Ecuadorians | 4.6 /100 | #231 | Tragic 3.9% |
| Cree | 4.3 /100 | #232 | Tragic 3.9% |
| Immigrants | Philippines | 4.1 /100 | #233 | Tragic 3.9% |
| Immigrants | Nonimmigrants | 4.0 /100 | #234 | Tragic 3.9% |
| Immigrants | Barbados | 4.0 /100 | #235 | Tragic 3.9% |
| Spanish Americans | 3.8 /100 | #236 | Tragic 3.9% |
| Immigrants | Trinidad and Tobago | 3.8 /100 | #237 | Tragic 3.9% |
| Colville | 2.6 /100 | #238 | Tragic 3.8% |
| British West Indians | 2.4 /100 | #239 | Tragic 3.8% |
| Immigrants | Ecuador | 2.3 /100 | #240 | Tragic 3.8% |
| Alaskan Athabascans | 2.3 /100 | #241 | Tragic 3.8% |
| Native Hawaiians | 2.3 /100 | #242 | Tragic 3.8% |