Native Hawaiian vs Iroquois 10th Grade
COMPARE
Native Hawaiian
Iroquois
10th Grade
10th Grade Comparison
Native Hawaiians
Iroquois
95.0%
10TH GRADE
99.7/ 100
METRIC RATING
64th/ 347
METRIC RANK
94.3%
10TH GRADE
92.8/ 100
METRIC RATING
129th/ 347
METRIC RANK
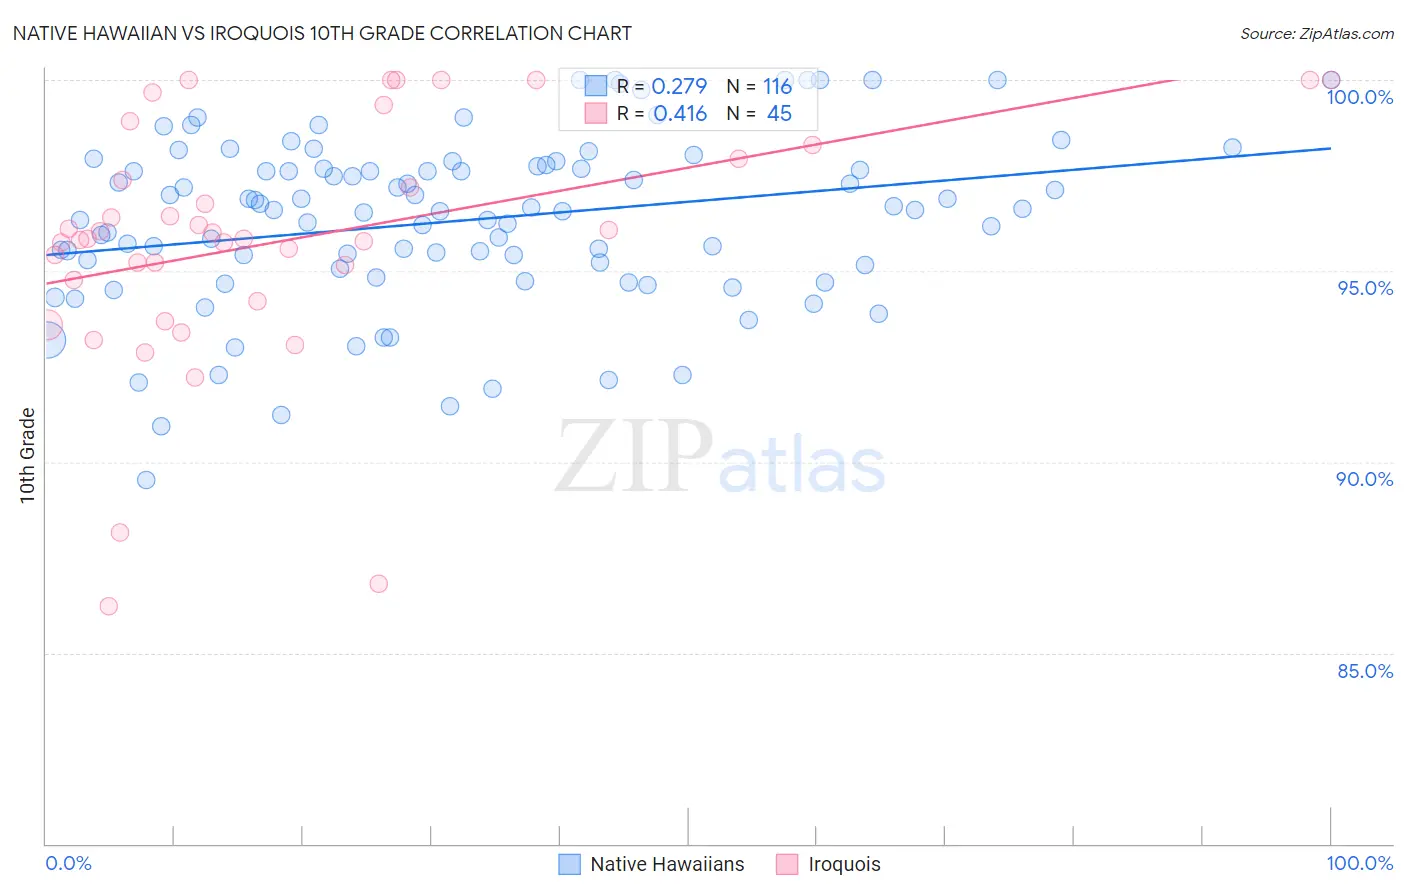
Native Hawaiian vs Iroquois 10th Grade Correlation Chart
The statistical analysis conducted on geographies consisting of 332,119,254 people shows a weak positive correlation between the proportion of Native Hawaiians and percentage of population with at least 10th grade education in the United States with a correlation coefficient (R) of 0.279 and weighted average of 95.0%. Similarly, the statistical analysis conducted on geographies consisting of 207,308,712 people shows a moderate positive correlation between the proportion of Iroquois and percentage of population with at least 10th grade education in the United States with a correlation coefficient (R) of 0.416 and weighted average of 94.3%, a difference of 0.76%.
10th Grade Correlation Summary
| Measurement | Native Hawaiian | Iroquois |
| Minimum | 89.5% | 86.2% |
| Maximum | 100.0% | 100.0% |
| Range | 10.5% | 13.8% |
| Mean | 96.3% | 95.8% |
| Median | 96.6% | 95.8% |
| Interquartile 25% (IQ1) | 95.1% | 94.5% |
| Interquartile 75% (IQ3) | 97.7% | 98.1% |
| Interquartile Range (IQR) | 2.6% | 3.6% |
| Standard Deviation (Sample) | 2.2% | 3.3% |
| Standard Deviation (Population) | 2.2% | 3.2% |
Similar Demographics by 10th Grade
Demographics Similar to Native Hawaiians by 10th Grade
In terms of 10th grade, the demographic groups most similar to Native Hawaiians are Thai (95.0%, a difference of 0.010%), Immigrants from Singapore (95.0%, a difference of 0.010%), Turkish (95.0%, a difference of 0.010%), Cypriot (95.0%, a difference of 0.020%), and Chippewa (95.0%, a difference of 0.020%).
| Demographics | Rating | Rank | 10th Grade |
| Ukrainians | 99.8 /100 | #57 | Exceptional 95.0% |
| Aleuts | 99.8 /100 | #58 | Exceptional 95.0% |
| Celtics | 99.8 /100 | #59 | Exceptional 95.0% |
| Cypriots | 99.8 /100 | #60 | Exceptional 95.0% |
| Chippewa | 99.8 /100 | #61 | Exceptional 95.0% |
| Thais | 99.8 /100 | #62 | Exceptional 95.0% |
| Immigrants | Singapore | 99.8 /100 | #63 | Exceptional 95.0% |
| Native Hawaiians | 99.7 /100 | #64 | Exceptional 95.0% |
| Turks | 99.7 /100 | #65 | Exceptional 95.0% |
| Immigrants | Australia | 99.7 /100 | #66 | Exceptional 94.9% |
| Immigrants | Netherlands | 99.7 /100 | #67 | Exceptional 94.9% |
| Immigrants | Belgium | 99.7 /100 | #68 | Exceptional 94.9% |
| Immigrants | England | 99.6 /100 | #69 | Exceptional 94.9% |
| Zimbabweans | 99.6 /100 | #70 | Exceptional 94.9% |
| Alaska Natives | 99.6 /100 | #71 | Exceptional 94.9% |
Demographics Similar to Iroquois by 10th Grade
In terms of 10th grade, the demographic groups most similar to Iroquois are Immigrants from Greece (94.3%, a difference of 0.0%), Immigrants from Eastern Europe (94.3%, a difference of 0.010%), Immigrants from Russia (94.3%, a difference of 0.010%), Potawatomi (94.3%, a difference of 0.030%), and Creek (94.2%, a difference of 0.030%).
| Demographics | Rating | Rank | 10th Grade |
| Inupiat | 95.1 /100 | #122 | Exceptional 94.4% |
| Cree | 95.1 /100 | #123 | Exceptional 94.4% |
| Basques | 94.9 /100 | #124 | Exceptional 94.3% |
| Americans | 94.4 /100 | #125 | Exceptional 94.3% |
| Immigrants | Iran | 94.4 /100 | #126 | Exceptional 94.3% |
| Israelis | 93.8 /100 | #127 | Exceptional 94.3% |
| Potawatomi | 93.6 /100 | #128 | Exceptional 94.3% |
| Iroquois | 92.8 /100 | #129 | Exceptional 94.3% |
| Immigrants | Greece | 92.7 /100 | #130 | Exceptional 94.3% |
| Immigrants | Eastern Europe | 92.5 /100 | #131 | Exceptional 94.3% |
| Immigrants | Russia | 92.4 /100 | #132 | Exceptional 94.3% |
| Creek | 91.9 /100 | #133 | Exceptional 94.2% |
| Osage | 91.7 /100 | #134 | Exceptional 94.2% |
| Immigrants | Korea | 91.3 /100 | #135 | Exceptional 94.2% |
| Shoshone | 90.8 /100 | #136 | Exceptional 94.2% |