Native Hawaiian vs Immigrants from South Africa 10th Grade
COMPARE
Native Hawaiian
Immigrants from South Africa
10th Grade
10th Grade Comparison
Native Hawaiians
Immigrants from South Africa
95.0%
10TH GRADE
99.7/ 100
METRIC RATING
64th/ 347
METRIC RANK
94.8%
10TH GRADE
99.5/ 100
METRIC RATING
77th/ 347
METRIC RANK
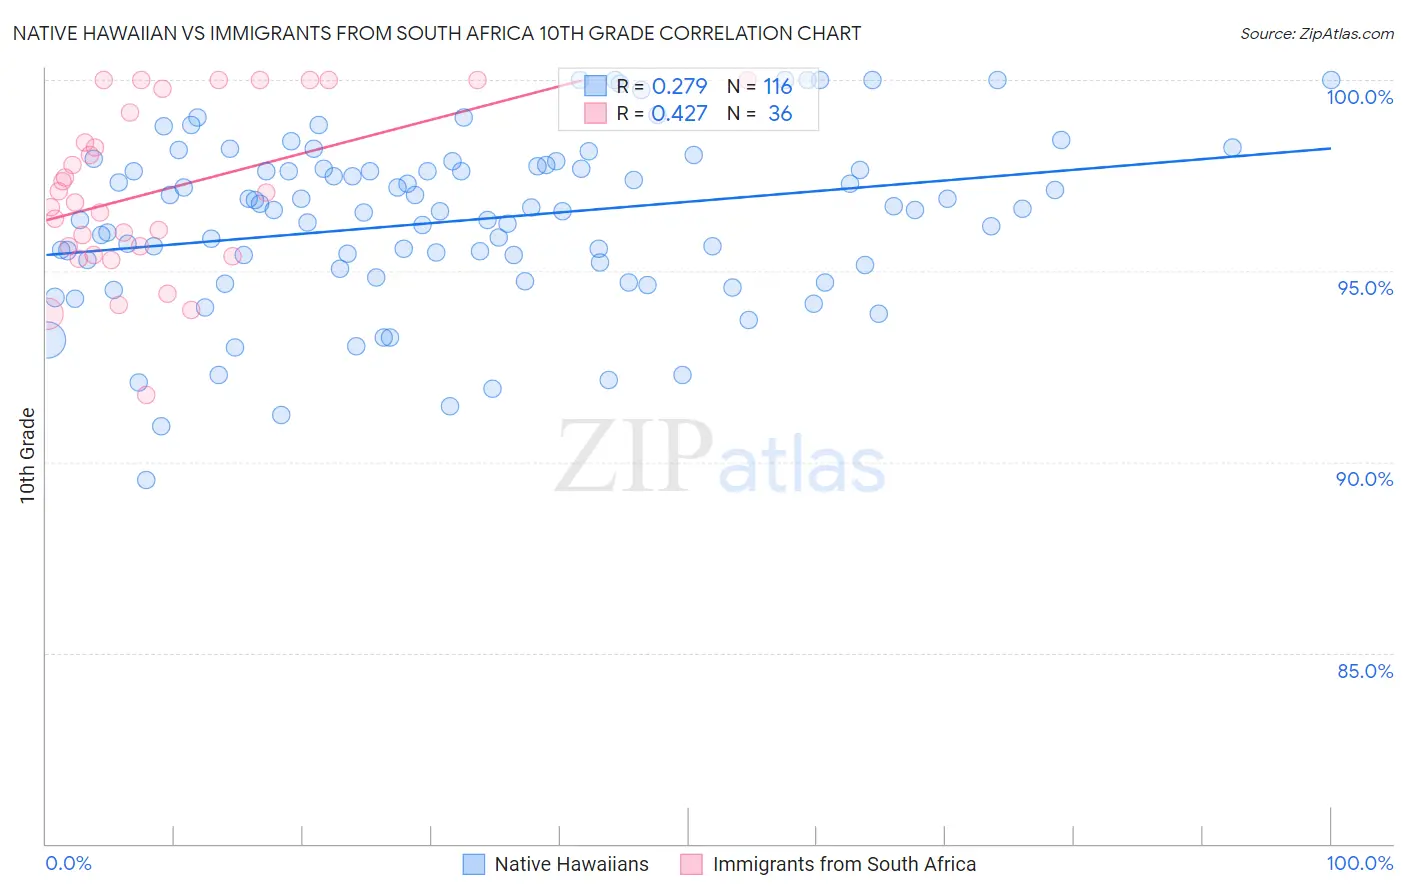
Native Hawaiian vs Immigrants from South Africa 10th Grade Correlation Chart
The statistical analysis conducted on geographies consisting of 332,119,254 people shows a weak positive correlation between the proportion of Native Hawaiians and percentage of population with at least 10th grade education in the United States with a correlation coefficient (R) of 0.279 and weighted average of 95.0%. Similarly, the statistical analysis conducted on geographies consisting of 233,321,693 people shows a moderate positive correlation between the proportion of Immigrants from South Africa and percentage of population with at least 10th grade education in the United States with a correlation coefficient (R) of 0.427 and weighted average of 94.8%, a difference of 0.16%.
10th Grade Correlation Summary
| Measurement | Native Hawaiian | Immigrants from South Africa |
| Minimum | 89.5% | 91.8% |
| Maximum | 100.0% | 100.0% |
| Range | 10.5% | 8.2% |
| Mean | 96.3% | 97.1% |
| Median | 96.6% | 96.9% |
| Interquartile 25% (IQ1) | 95.1% | 95.5% |
| Interquartile 75% (IQ3) | 97.7% | 99.5% |
| Interquartile Range (IQR) | 2.6% | 3.9% |
| Standard Deviation (Sample) | 2.2% | 2.2% |
| Standard Deviation (Population) | 2.2% | 2.2% |
Demographics Similar to Native Hawaiians and Immigrants from South Africa by 10th Grade
In terms of 10th grade, the demographic groups most similar to Native Hawaiians are Thai (95.0%, a difference of 0.010%), Immigrants from Singapore (95.0%, a difference of 0.010%), Turkish (95.0%, a difference of 0.010%), Cypriot (95.0%, a difference of 0.020%), and Chippewa (95.0%, a difference of 0.020%). Similarly, the demographic groups most similar to Immigrants from South Africa are Romanian (94.8%, a difference of 0.0%), Okinawan (94.8%, a difference of 0.010%), Bhutanese (94.9%, a difference of 0.040%), Canadian (94.9%, a difference of 0.040%), and Immigrants from Sweden (94.9%, a difference of 0.050%).
| Demographics | Rating | Rank | 10th Grade |
| Cypriots | 99.8 /100 | #60 | Exceptional 95.0% |
| Chippewa | 99.8 /100 | #61 | Exceptional 95.0% |
| Thais | 99.8 /100 | #62 | Exceptional 95.0% |
| Immigrants | Singapore | 99.8 /100 | #63 | Exceptional 95.0% |
| Native Hawaiians | 99.7 /100 | #64 | Exceptional 95.0% |
| Turks | 99.7 /100 | #65 | Exceptional 95.0% |
| Immigrants | Australia | 99.7 /100 | #66 | Exceptional 94.9% |
| Immigrants | Netherlands | 99.7 /100 | #67 | Exceptional 94.9% |
| Immigrants | Belgium | 99.7 /100 | #68 | Exceptional 94.9% |
| Immigrants | England | 99.6 /100 | #69 | Exceptional 94.9% |
| Zimbabweans | 99.6 /100 | #70 | Exceptional 94.9% |
| Alaska Natives | 99.6 /100 | #71 | Exceptional 94.9% |
| Immigrants | Sweden | 99.6 /100 | #72 | Exceptional 94.9% |
| Bhutanese | 99.6 /100 | #73 | Exceptional 94.9% |
| Canadians | 99.6 /100 | #74 | Exceptional 94.9% |
| Okinawans | 99.5 /100 | #75 | Exceptional 94.8% |
| Romanians | 99.5 /100 | #76 | Exceptional 94.8% |
| Immigrants | South Africa | 99.5 /100 | #77 | Exceptional 94.8% |
| Filipinos | 99.3 /100 | #78 | Exceptional 94.8% |
| Immigrants | Czechoslovakia | 99.2 /100 | #79 | Exceptional 94.7% |
| Immigrants | Denmark | 99.2 /100 | #80 | Exceptional 94.7% |