Native Hawaiian vs Immigrants from Vietnam Master's Degree
COMPARE
Native Hawaiian
Immigrants from Vietnam
Master's Degree
Master's Degree Comparison
Native Hawaiians
Immigrants from Vietnam
12.3%
MASTER'S DEGREE
0.4/ 100
METRIC RATING
268th/ 347
METRIC RANK
14.1%
MASTER'S DEGREE
16.1/ 100
METRIC RATING
215th/ 347
METRIC RANK
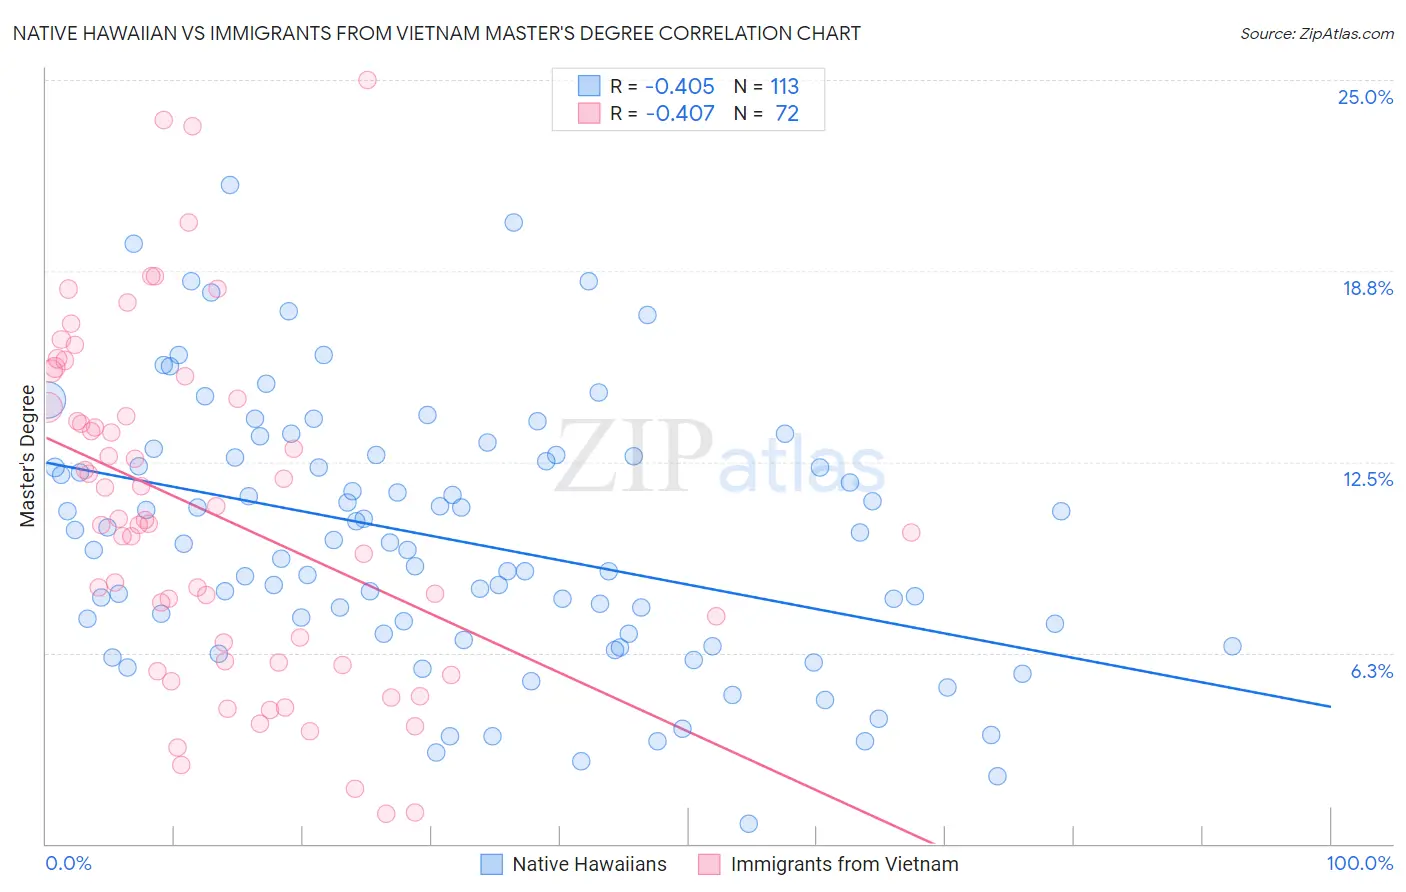
Native Hawaiian vs Immigrants from Vietnam Master's Degree Correlation Chart
The statistical analysis conducted on geographies consisting of 331,993,675 people shows a moderate negative correlation between the proportion of Native Hawaiians and percentage of population with at least master's degree education in the United States with a correlation coefficient (R) of -0.405 and weighted average of 12.3%. Similarly, the statistical analysis conducted on geographies consisting of 404,720,080 people shows a moderate negative correlation between the proportion of Immigrants from Vietnam and percentage of population with at least master's degree education in the United States with a correlation coefficient (R) of -0.407 and weighted average of 14.1%, a difference of 15.2%.
Master's Degree Correlation Summary
| Measurement | Native Hawaiian | Immigrants from Vietnam |
| Minimum | 0.67% | 0.99% |
| Maximum | 21.6% | 25.0% |
| Range | 20.9% | 24.0% |
| Mean | 10.0% | 10.8% |
| Median | 9.8% | 10.5% |
| Interquartile 25% (IQ1) | 6.9% | 6.0% |
| Interquartile 75% (IQ3) | 12.7% | 14.4% |
| Interquartile Range (IQR) | 5.8% | 8.5% |
| Standard Deviation (Sample) | 4.2% | 5.6% |
| Standard Deviation (Population) | 4.2% | 5.5% |
Similar Demographics by Master's Degree
Demographics Similar to Native Hawaiians by Master's Degree
In terms of master's degree, the demographic groups most similar to Native Hawaiians are American (12.3%, a difference of 0.25%), Central American (12.2%, a difference of 0.65%), Salvadoran (12.2%, a difference of 0.78%), Bahamian (12.4%, a difference of 1.0%), and Immigrants from Fiji (12.4%, a difference of 1.2%).
| Demographics | Rating | Rank | Master's Degree |
| Tongans | 0.6 /100 | #261 | Tragic 12.5% |
| Nicaraguans | 0.6 /100 | #262 | Tragic 12.5% |
| Central American Indians | 0.5 /100 | #263 | Tragic 12.4% |
| Belizeans | 0.5 /100 | #264 | Tragic 12.4% |
| Immigrants | Fiji | 0.5 /100 | #265 | Tragic 12.4% |
| Bahamians | 0.5 /100 | #266 | Tragic 12.4% |
| Americans | 0.4 /100 | #267 | Tragic 12.3% |
| Native Hawaiians | 0.4 /100 | #268 | Tragic 12.3% |
| Central Americans | 0.3 /100 | #269 | Tragic 12.2% |
| Salvadorans | 0.3 /100 | #270 | Tragic 12.2% |
| Haitians | 0.3 /100 | #271 | Tragic 12.1% |
| Comanche | 0.3 /100 | #272 | Tragic 12.1% |
| Blackfeet | 0.3 /100 | #273 | Tragic 12.1% |
| Cape Verdeans | 0.3 /100 | #274 | Tragic 12.1% |
| Cubans | 0.3 /100 | #275 | Tragic 12.1% |
Demographics Similar to Immigrants from Vietnam by Master's Degree
In terms of master's degree, the demographic groups most similar to Immigrants from Vietnam are Immigrants from Somalia (14.1%, a difference of 0.070%), Immigrants from Trinidad and Tobago (14.1%, a difference of 0.070%), Finnish (14.2%, a difference of 0.21%), Immigrants from Thailand (14.2%, a difference of 0.22%), and French Canadian (14.1%, a difference of 0.32%).
| Demographics | Rating | Rank | Master's Degree |
| Immigrants | Barbados | 20.5 /100 | #208 | Fair 14.3% |
| Immigrants | Panama | 20.0 /100 | #209 | Fair 14.3% |
| Sub-Saharan Africans | 19.4 /100 | #210 | Poor 14.2% |
| Somalis | 18.0 /100 | #211 | Poor 14.2% |
| Spanish | 17.8 /100 | #212 | Poor 14.2% |
| Immigrants | Thailand | 17.0 /100 | #213 | Poor 14.2% |
| Finns | 16.9 /100 | #214 | Poor 14.2% |
| Immigrants | Vietnam | 16.1 /100 | #215 | Poor 14.1% |
| Immigrants | Somalia | 15.8 /100 | #216 | Poor 14.1% |
| Immigrants | Trinidad and Tobago | 15.8 /100 | #217 | Poor 14.1% |
| French Canadians | 14.9 /100 | #218 | Poor 14.1% |
| Norwegians | 13.6 /100 | #219 | Poor 14.0% |
| Germans | 13.1 /100 | #220 | Poor 14.0% |
| Koreans | 12.7 /100 | #221 | Poor 14.0% |
| Ecuadorians | 12.6 /100 | #222 | Poor 14.0% |