Malaysian vs Immigrants from Vietnam Master's Degree
COMPARE
Malaysian
Immigrants from Vietnam
Master's Degree
Master's Degree Comparison
Malaysians
Immigrants from Vietnam
12.0%
MASTER'S DEGREE
0.2/ 100
METRIC RATING
281st/ 347
METRIC RANK
14.1%
MASTER'S DEGREE
16.1/ 100
METRIC RATING
215th/ 347
METRIC RANK
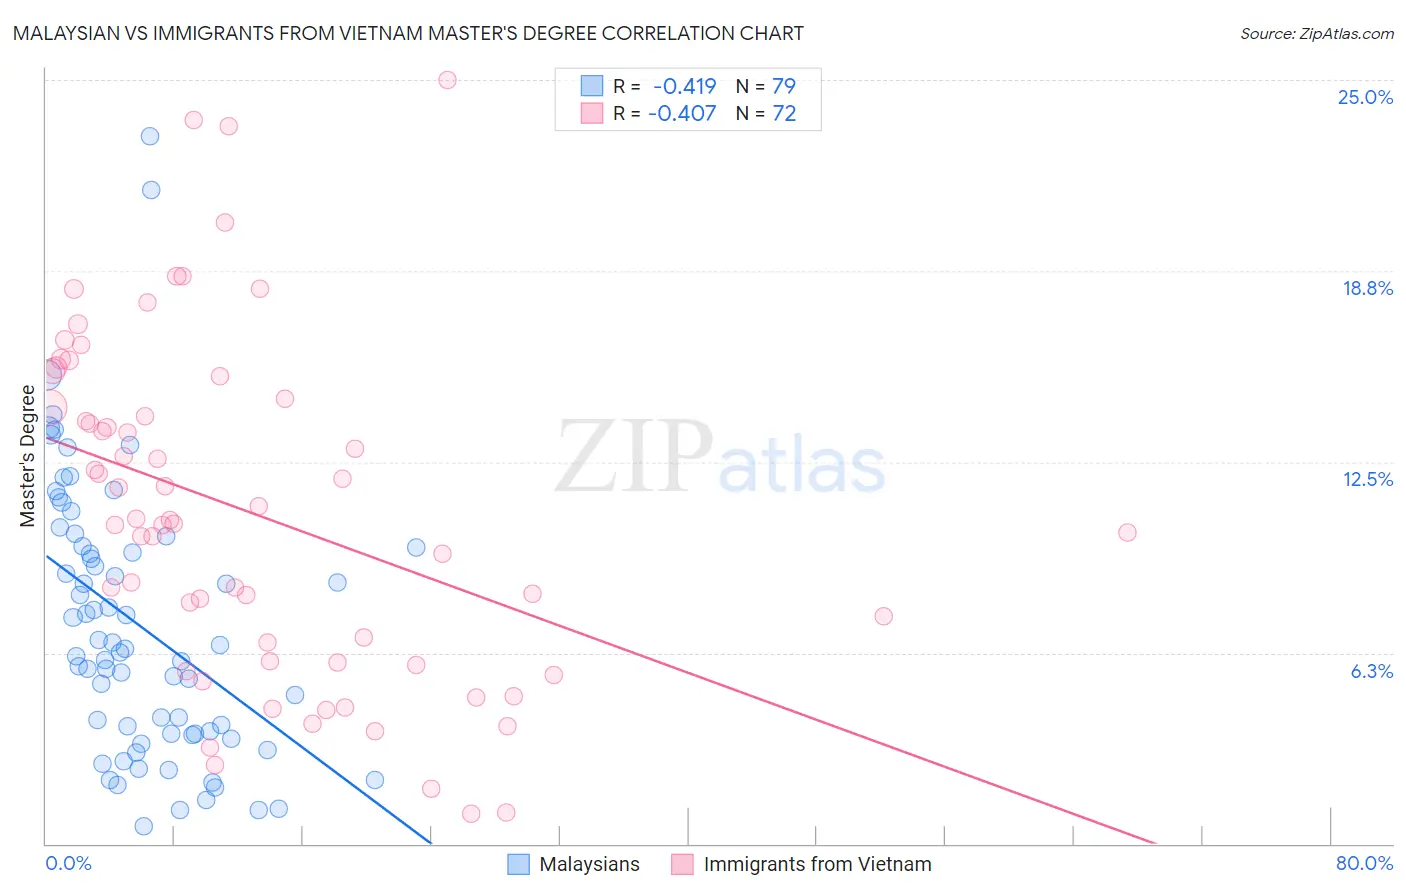
Malaysian vs Immigrants from Vietnam Master's Degree Correlation Chart
The statistical analysis conducted on geographies consisting of 226,048,565 people shows a moderate negative correlation between the proportion of Malaysians and percentage of population with at least master's degree education in the United States with a correlation coefficient (R) of -0.419 and weighted average of 12.0%. Similarly, the statistical analysis conducted on geographies consisting of 404,720,080 people shows a moderate negative correlation between the proportion of Immigrants from Vietnam and percentage of population with at least master's degree education in the United States with a correlation coefficient (R) of -0.407 and weighted average of 14.1%, a difference of 17.4%.
Master's Degree Correlation Summary
| Measurement | Malaysian | Immigrants from Vietnam |
| Minimum | 0.56% | 0.99% |
| Maximum | 23.1% | 25.0% |
| Range | 22.6% | 24.0% |
| Mean | 7.1% | 10.8% |
| Median | 6.4% | 10.5% |
| Interquartile 25% (IQ1) | 3.6% | 6.0% |
| Interquartile 75% (IQ3) | 9.7% | 14.4% |
| Interquartile Range (IQR) | 6.1% | 8.5% |
| Standard Deviation (Sample) | 4.5% | 5.6% |
| Standard Deviation (Population) | 4.5% | 5.5% |
Similar Demographics by Master's Degree
Demographics Similar to Malaysians by Master's Degree
In terms of master's degree, the demographic groups most similar to Malaysians are Immigrants from Dominican Republic (12.1%, a difference of 0.12%), Immigrants from Belize (12.1%, a difference of 0.18%), Immigrants from Caribbean (12.1%, a difference of 0.26%), Potawatomi (12.1%, a difference of 0.26%), and Black/African American (12.1%, a difference of 0.27%).
| Demographics | Rating | Rank | Master's Degree |
| Cape Verdeans | 0.3 /100 | #274 | Tragic 12.1% |
| Cubans | 0.3 /100 | #275 | Tragic 12.1% |
| Blacks/African Americans | 0.3 /100 | #276 | Tragic 12.1% |
| Immigrants | Caribbean | 0.3 /100 | #277 | Tragic 12.1% |
| Potawatomi | 0.3 /100 | #278 | Tragic 12.1% |
| Immigrants | Belize | 0.2 /100 | #279 | Tragic 12.1% |
| Immigrants | Dominican Republic | 0.2 /100 | #280 | Tragic 12.1% |
| Malaysians | 0.2 /100 | #281 | Tragic 12.0% |
| Immigrants | El Salvador | 0.2 /100 | #282 | Tragic 12.0% |
| Hondurans | 0.2 /100 | #283 | Tragic 11.9% |
| Ottawa | 0.2 /100 | #284 | Tragic 11.9% |
| Immigrants | Nicaragua | 0.2 /100 | #285 | Tragic 11.8% |
| Aleuts | 0.1 /100 | #286 | Tragic 11.8% |
| Immigrants | Haiti | 0.1 /100 | #287 | Tragic 11.8% |
| Immigrants | Honduras | 0.1 /100 | #288 | Tragic 11.8% |
Demographics Similar to Immigrants from Vietnam by Master's Degree
In terms of master's degree, the demographic groups most similar to Immigrants from Vietnam are Immigrants from Somalia (14.1%, a difference of 0.070%), Immigrants from Trinidad and Tobago (14.1%, a difference of 0.070%), Finnish (14.2%, a difference of 0.21%), Immigrants from Thailand (14.2%, a difference of 0.22%), and French Canadian (14.1%, a difference of 0.32%).
| Demographics | Rating | Rank | Master's Degree |
| Immigrants | Barbados | 20.5 /100 | #208 | Fair 14.3% |
| Immigrants | Panama | 20.0 /100 | #209 | Fair 14.3% |
| Sub-Saharan Africans | 19.4 /100 | #210 | Poor 14.2% |
| Somalis | 18.0 /100 | #211 | Poor 14.2% |
| Spanish | 17.8 /100 | #212 | Poor 14.2% |
| Immigrants | Thailand | 17.0 /100 | #213 | Poor 14.2% |
| Finns | 16.9 /100 | #214 | Poor 14.2% |
| Immigrants | Vietnam | 16.1 /100 | #215 | Poor 14.1% |
| Immigrants | Somalia | 15.8 /100 | #216 | Poor 14.1% |
| Immigrants | Trinidad and Tobago | 15.8 /100 | #217 | Poor 14.1% |
| French Canadians | 14.9 /100 | #218 | Poor 14.1% |
| Norwegians | 13.6 /100 | #219 | Poor 14.0% |
| Germans | 13.1 /100 | #220 | Poor 14.0% |
| Koreans | 12.7 /100 | #221 | Poor 14.0% |
| Ecuadorians | 12.6 /100 | #222 | Poor 14.0% |