Malaysian vs Cheyenne College, Under 1 year
COMPARE
Malaysian
Cheyenne
College, Under 1 year
College, Under 1 year Comparison
Malaysians
Cheyenne
62.2%
COLLEGE, UNDER 1 YEAR
1.1/ 100
METRIC RATING
242nd/ 347
METRIC RANK
60.6%
COLLEGE, UNDER 1 YEAR
0.1/ 100
METRIC RATING
270th/ 347
METRIC RANK
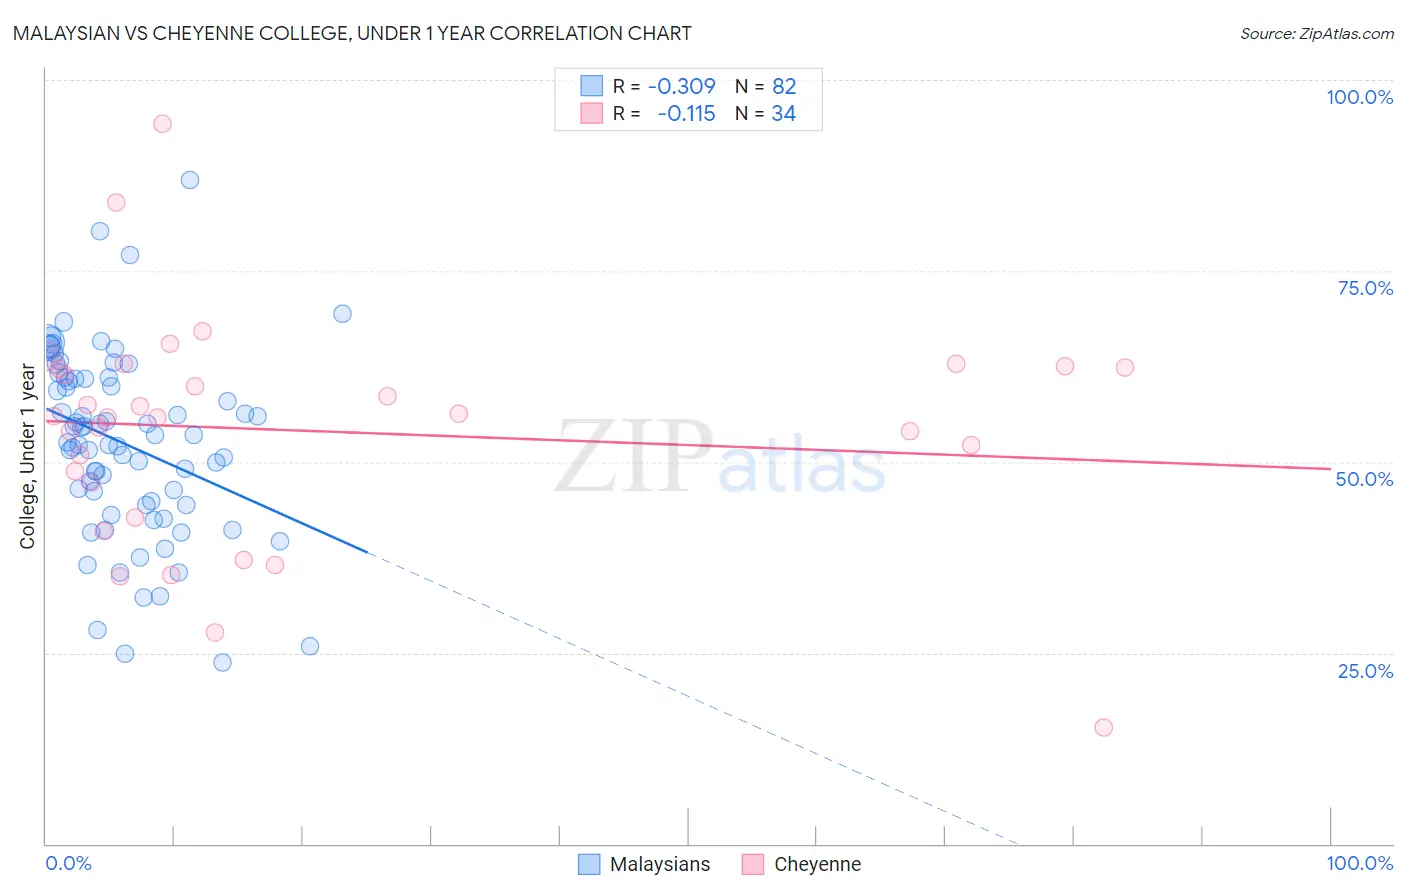
Malaysian vs Cheyenne College, Under 1 year Correlation Chart
The statistical analysis conducted on geographies consisting of 226,109,118 people shows a mild negative correlation between the proportion of Malaysians and percentage of population with at least college, under 1 year education in the United States with a correlation coefficient (R) of -0.309 and weighted average of 62.2%. Similarly, the statistical analysis conducted on geographies consisting of 80,719,411 people shows a poor negative correlation between the proportion of Cheyenne and percentage of population with at least college, under 1 year education in the United States with a correlation coefficient (R) of -0.115 and weighted average of 60.6%, a difference of 2.6%.
College, Under 1 year Correlation Summary
| Measurement | Malaysian | Cheyenne |
| Minimum | 23.8% | 15.3% |
| Maximum | 86.9% | 94.3% |
| Range | 63.2% | 79.1% |
| Mean | 52.4% | 54.1% |
| Median | 53.0% | 55.9% |
| Interquartile 25% (IQ1) | 44.4% | 47.3% |
| Interquartile 75% (IQ3) | 60.9% | 62.4% |
| Interquartile Range (IQR) | 16.6% | 15.0% |
| Standard Deviation (Sample) | 12.1% | 14.9% |
| Standard Deviation (Population) | 12.1% | 14.7% |
Similar Demographics by College, Under 1 year
Demographics Similar to Malaysians by College, Under 1 year
In terms of college, under 1 year, the demographic groups most similar to Malaysians are Hawaiian (62.1%, a difference of 0.030%), Ottawa (62.2%, a difference of 0.050%), Nepalese (62.2%, a difference of 0.060%), Aleut (62.2%, a difference of 0.060%), and Colville (62.1%, a difference of 0.12%).
| Demographics | Rating | Rank | College, Under 1 year |
| Spanish Americans | 1.9 /100 | #235 | Tragic 62.6% |
| Immigrants | Immigrants | 1.7 /100 | #236 | Tragic 62.5% |
| Immigrants | Burma/Myanmar | 1.6 /100 | #237 | Tragic 62.5% |
| French American Indians | 1.5 /100 | #238 | Tragic 62.4% |
| Nepalese | 1.1 /100 | #239 | Tragic 62.2% |
| Aleuts | 1.1 /100 | #240 | Tragic 62.2% |
| Ottawa | 1.1 /100 | #241 | Tragic 62.2% |
| Malaysians | 1.1 /100 | #242 | Tragic 62.2% |
| Hawaiians | 1.1 /100 | #243 | Tragic 62.1% |
| Colville | 1.0 /100 | #244 | Tragic 62.1% |
| Delaware | 0.9 /100 | #245 | Tragic 62.1% |
| Marshallese | 0.8 /100 | #246 | Tragic 61.9% |
| Immigrants | Liberia | 0.8 /100 | #247 | Tragic 61.9% |
| Potawatomi | 0.6 /100 | #248 | Tragic 61.8% |
| Vietnamese | 0.5 /100 | #249 | Tragic 61.7% |
Demographics Similar to Cheyenne by College, Under 1 year
In terms of college, under 1 year, the demographic groups most similar to Cheyenne are U.S. Virgin Islander (60.6%, a difference of 0.020%), Immigrants from West Indies (60.6%, a difference of 0.11%), Jamaican (60.5%, a difference of 0.17%), Chickasaw (60.4%, a difference of 0.22%), and Alaska Native (60.4%, a difference of 0.22%).
| Demographics | Rating | Rank | College, Under 1 year |
| Shoshone | 0.2 /100 | #263 | Tragic 61.1% |
| Trinidadians and Tobagonians | 0.2 /100 | #264 | Tragic 61.1% |
| Immigrants | Bahamas | 0.2 /100 | #265 | Tragic 61.1% |
| Alaskan Athabascans | 0.2 /100 | #266 | Tragic 61.0% |
| Americans | 0.2 /100 | #267 | Tragic 61.0% |
| Immigrants | Trinidad and Tobago | 0.1 /100 | #268 | Tragic 60.7% |
| Immigrants | West Indies | 0.1 /100 | #269 | Tragic 60.6% |
| Cheyenne | 0.1 /100 | #270 | Tragic 60.6% |
| U.S. Virgin Islanders | 0.1 /100 | #271 | Tragic 60.6% |
| Jamaicans | 0.1 /100 | #272 | Tragic 60.5% |
| Chickasaw | 0.1 /100 | #273 | Tragic 60.4% |
| Alaska Natives | 0.1 /100 | #274 | Tragic 60.4% |
| Immigrants | Barbados | 0.1 /100 | #275 | Tragic 60.4% |
| Arapaho | 0.1 /100 | #276 | Tragic 60.3% |
| Bahamians | 0.1 /100 | #277 | Tragic 60.3% |