Lebanese vs Immigrants from Bolivia 2nd Grade
COMPARE
Lebanese
Immigrants from Bolivia
2nd Grade
2nd Grade Comparison
Lebanese
Immigrants from Bolivia
98.1%
2ND GRADE
94.2/ 100
METRIC RATING
122nd/ 347
METRIC RANK
97.4%
2ND GRADE
0.1/ 100
METRIC RATING
273rd/ 347
METRIC RANK
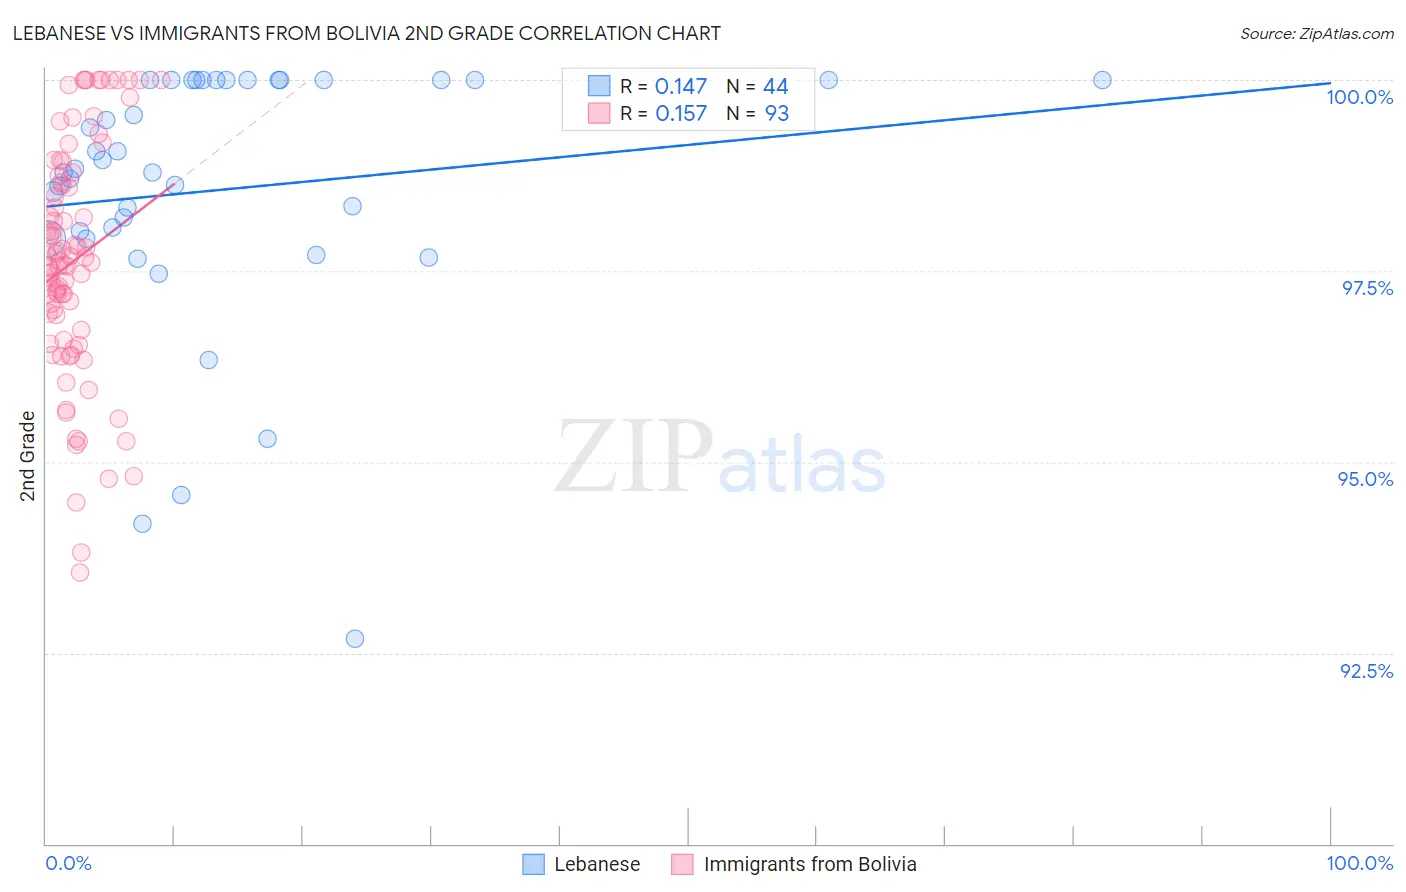
Lebanese vs Immigrants from Bolivia 2nd Grade Correlation Chart
The statistical analysis conducted on geographies consisting of 401,624,157 people shows a poor positive correlation between the proportion of Lebanese and percentage of population with at least 2nd grade education in the United States with a correlation coefficient (R) of 0.147 and weighted average of 98.1%. Similarly, the statistical analysis conducted on geographies consisting of 158,719,692 people shows a poor positive correlation between the proportion of Immigrants from Bolivia and percentage of population with at least 2nd grade education in the United States with a correlation coefficient (R) of 0.157 and weighted average of 97.4%, a difference of 0.75%.
2nd Grade Correlation Summary
| Measurement | Lebanese | Immigrants from Bolivia |
| Minimum | 92.7% | 93.6% |
| Maximum | 100.0% | 100.0% |
| Range | 7.3% | 6.4% |
| Mean | 98.6% | 97.6% |
| Median | 98.8% | 97.6% |
| Interquartile 25% (IQ1) | 98.0% | 96.7% |
| Interquartile 75% (IQ3) | 100.0% | 98.7% |
| Interquartile Range (IQR) | 2.0% | 2.0% |
| Standard Deviation (Sample) | 1.7% | 1.5% |
| Standard Deviation (Population) | 1.7% | 1.5% |
Similar Demographics by 2nd Grade
Demographics Similar to Lebanese by 2nd Grade
In terms of 2nd grade, the demographic groups most similar to Lebanese are Immigrants from Zimbabwe (98.1%, a difference of 0.0%), Immigrants from Japan (98.1%, a difference of 0.0%), Menominee (98.1%, a difference of 0.0%), Iroquois (98.1%, a difference of 0.0%), and Syrian (98.1%, a difference of 0.0%).
| Demographics | Rating | Rank | 2nd Grade |
| Iranians | 95.9 /100 | #115 | Exceptional 98.1% |
| Spanish | 95.8 /100 | #116 | Exceptional 98.1% |
| Ute | 95.7 /100 | #117 | Exceptional 98.1% |
| Immigrants | France | 95.6 /100 | #118 | Exceptional 98.1% |
| Thais | 95.3 /100 | #119 | Exceptional 98.1% |
| Okinawans | 94.9 /100 | #120 | Exceptional 98.1% |
| Immigrants | Zimbabwe | 94.4 /100 | #121 | Exceptional 98.1% |
| Lebanese | 94.2 /100 | #122 | Exceptional 98.1% |
| Immigrants | Japan | 94.1 /100 | #123 | Exceptional 98.1% |
| Menominee | 94.1 /100 | #124 | Exceptional 98.1% |
| Iroquois | 94.1 /100 | #125 | Exceptional 98.1% |
| Syrians | 94.0 /100 | #126 | Exceptional 98.1% |
| Immigrants | Saudi Arabia | 93.6 /100 | #127 | Exceptional 98.1% |
| Immigrants | Serbia | 92.3 /100 | #128 | Exceptional 98.1% |
| Immigrants | Croatia | 92.1 /100 | #129 | Exceptional 98.1% |
Demographics Similar to Immigrants from Bolivia by 2nd Grade
In terms of 2nd grade, the demographic groups most similar to Immigrants from Bolivia are Immigrants from Peru (97.4%, a difference of 0.010%), Ghanaian (97.4%, a difference of 0.010%), Immigrants from China (97.3%, a difference of 0.010%), Immigrants from Cameroon (97.4%, a difference of 0.020%), and Immigrants from Jamaica (97.4%, a difference of 0.040%).
| Demographics | Rating | Rank | 2nd Grade |
| Immigrants | Sierra Leone | 0.4 /100 | #266 | Tragic 97.4% |
| Cubans | 0.3 /100 | #267 | Tragic 97.4% |
| Immigrants | Nigeria | 0.3 /100 | #268 | Tragic 97.4% |
| West Indians | 0.3 /100 | #269 | Tragic 97.4% |
| Immigrants | Jamaica | 0.2 /100 | #270 | Tragic 97.4% |
| Immigrants | Cameroon | 0.2 /100 | #271 | Tragic 97.4% |
| Immigrants | Peru | 0.1 /100 | #272 | Tragic 97.4% |
| Immigrants | Bolivia | 0.1 /100 | #273 | Tragic 97.4% |
| Ghanaians | 0.1 /100 | #274 | Tragic 97.4% |
| Immigrants | China | 0.1 /100 | #275 | Tragic 97.3% |
| Immigrants | Philippines | 0.1 /100 | #276 | Tragic 97.3% |
| Immigrants | Western Africa | 0.1 /100 | #277 | Tragic 97.3% |
| Immigrants | Uzbekistan | 0.1 /100 | #278 | Tragic 97.3% |
| Immigrants | Ghana | 0.1 /100 | #279 | Tragic 97.3% |
| Afghans | 0.1 /100 | #280 | Tragic 97.3% |