Bangladeshi vs Immigrants from Bolivia 2nd Grade

COMPARE

Bangladeshi
Race
Ancestry
AfghanAfricanAlaska NativeAlaskan AthabascanAlbanianAleutAlsatianAmericanApacheArabArapahoArgentineanArmenianAssyrian/Chaldean/SyriacAustralianAustrianBahamianBangladeshiBarbadianBasqueBelgianBelizeanBermudanBhutaneseBlackfeetBolivianBrazilianBritishBritish West IndianBulgarianBurmeseCajunCambodianCanadianCape VerdeanCarpatho RusynCelticCentral AmericanCentral American IndianCherokeeCheyenneChickasawChileanChineseChippewaChoctawColombianColvilleComancheCosta RicanCreeCreekCroatianCrowCubanCypriotCzechCzechoslovakianDanishDelawareDominicanDutchDutch West IndianEastern EuropeanEcuadorianEgyptianEnglishEstonianEthiopianEuropeanFijianFilipinoFinnishFrenchFrench American IndianFrench CanadianGermanGerman RussianGhanaianGreekGuamanian/ChamorroGuatemalanGuyaneseHaitianHmongHonduranHopiHoumaHungarianIcelanderIndian (Asian)IndonesianInupiatIranianIraqiIrishIroquoisIsraeliItalianJamaicanJapaneseJordanianKenyanKiowaKoreanLaotianLatvianLebaneseLiberianLithuanianLumbeeLuxembourgerMacedonianMalaysianMalteseMarshalleseMenomineeMexicanMexican American IndianMongolianMoroccanNative HawaiianNavajoNepaleseNew ZealanderNicaraguanNigerianNorthern EuropeanNorwegianOkinawanOsageOttawaPaiutePakistaniPalestinianPanamanianParaguayanPennsylvania GermanPeruvianPimaPolishPortuguesePotawatomiPuebloPuerto RicanPuget Sound SalishRomanianRussianSalvadoranSamoanScandinavianScotch-IrishScottishSeminoleSenegaleseSerbianShoshoneSierra LeoneanSiouxSlavicSlovakSloveneSomaliSouth AfricanSouth AmericanSouth American IndianSoviet UnionSpaniardSpanishSpanish AmericanSpanish American IndianSri LankanSubsaharan AfricanSudaneseSwedishSwissSyrianTaiwaneseThaiTlingit-HaidaTohono O'OdhamTonganTrinidadian and TobagonianTsimshianTurkishU.S. Virgin IslanderUgandanUkrainianUruguayanUteVenezuelanVietnameseWelshWest IndianYakamaYaquiYugoslavianYumanYup'ikZimbabwean
Immigration
NonimmigrantsImmigrantsAfghanistanAfricaAlbaniaArgentinaArmeniaAsiaAustraliaAustriaBahamasBangladeshBarbadosBelarusBelgiumBelizeBosnia and HerzegovinaBrazilBulgariaBurma/MyanmarCabo VerdeCambodiaCameroonCanadaCaribbeanCentral AmericaChileChinaColombiaCongoCosta RicaCroatiaCubaCzechoslovakiaDenmarkDominicaDominican RepublicEastern AfricaEastern AsiaEastern EuropeEcuadorEgyptEl SalvadorEnglandEritreaEthiopiaEuropeFijiFranceGermanyGhanaGreeceGrenadaGuatemalaGuyanaHaitiHondurasHong KongHungaryIndiaIndonesiaIranIraqIrelandIsraelItalyJamaicaJapanJordanKazakhstanKenyaKoreaKuwaitLaosLatin AmericaLatviaLebanonLiberiaLithuaniaMalaysiaMexicoMicronesiaMiddle AfricaMoldovaMoroccoNepalNetherlandsNicaraguaNigeriaNorth AmericaNorth MacedoniaNorthern AfricaNorthern EuropeNorwayOceaniaPakistanPanamaPeruPhilippinesPolandPortugalRomaniaRussiaSaudi ArabiaScotlandSenegalSerbiaSierra LeoneSingaporeSomaliaSouth AfricaSouth AmericaSouth Central AsiaSouth Eastern AsiaSouthern EuropeSpainSri LankaSt. Vincent and the GrenadinesSudanSwedenSwitzerlandSyriaTaiwanThailandTrinidad and TobagoTurkeyUgandaUkraineUruguayUzbekistanVenezuelaVietnamWest IndiesWestern AfricaWestern AsiaWestern EuropeYemenZaireZimbabweAzores
Immigrants from Bolivia
Race
Ancestry
AfghanAfricanAlaska NativeAlaskan AthabascanAlbanianAleutAlsatianAmericanApacheArabArapahoArgentineanArmenianAssyrian/Chaldean/SyriacAustralianAustrianBahamianBarbadianBasqueBelgianBelizeanBermudanBhutaneseBlackfeetBolivianBrazilianBritishBritish West IndianBulgarianBurmeseCajunCambodianCanadianCape VerdeanCarpatho RusynCelticCentral AmericanCentral American IndianCherokeeCheyenneChickasawChileanChineseChippewaChoctawColombianColvilleComancheCosta RicanCreeCreekCroatianCrowCubanCypriotCzechCzechoslovakianDanishDelawareDominicanDutchDutch West IndianEastern EuropeanEcuadorianEgyptianEnglishEstonianEthiopianEuropeanFijianFilipinoFinnishFrenchFrench American IndianFrench CanadianGermanGerman RussianGhanaianGreekGuamanian/ChamorroGuatemalanGuyaneseHaitianHmongHonduranHopiHoumaHungarianIcelanderIndian (Asian)IndonesianInupiatIranianIraqiIrishIroquoisIsraeliItalianJamaicanJapaneseJordanianKenyanKiowaKoreanLaotianLatvianLebaneseLiberianLithuanianLumbeeLuxembourgerMacedonianMalaysianMalteseMarshalleseMenomineeMexicanMexican American IndianMongolianMoroccanNative HawaiianNavajoNepaleseNew ZealanderNicaraguanNigerianNorthern EuropeanNorwegianOkinawanOsageOttawaPaiutePakistaniPalestinianPanamanianParaguayanPennsylvania GermanPeruvianPimaPolishPortuguesePotawatomiPuebloPuerto RicanPuget Sound SalishRomanianRussianSalvadoranSamoanScandinavianScotch-IrishScottishSeminoleSenegaleseSerbianShoshoneSierra LeoneanSiouxSlavicSlovakSloveneSomaliSouth AfricanSouth AmericanSouth American IndianSoviet UnionSpaniardSpanishSpanish AmericanSpanish American IndianSri LankanSubsaharan AfricanSudaneseSwedishSwissSyrianTaiwaneseThaiTlingit-HaidaTohono O'OdhamTonganTrinidadian and TobagonianTsimshianTurkishU.S. Virgin IslanderUgandanUkrainianUruguayanUteVenezuelanVietnameseWelshWest IndianYakamaYaquiYugoslavianYumanYup'ikZimbabwean
Immigration
NonimmigrantsImmigrantsAfghanistanAfricaAlbaniaArgentinaArmeniaAsiaAustraliaAustriaBahamasBangladeshBarbadosBelarusBelgiumBelizeBoliviaBosnia and HerzegovinaBrazilBulgariaBurma/MyanmarCabo VerdeCambodiaCameroonCanadaCaribbeanCentral AmericaChileChinaColombiaCongoCosta RicaCroatiaCubaCzechoslovakiaDenmarkDominicaDominican RepublicEastern AfricaEastern AsiaEastern EuropeEcuadorEgyptEl SalvadorEnglandEritreaEthiopiaEuropeFijiFranceGermanyGhanaGreeceGrenadaGuatemalaGuyanaHaitiHondurasHong KongHungaryIndiaIndonesiaIranIraqIrelandIsraelItalyJamaicaJapanJordanKazakhstanKenyaKoreaKuwaitLaosLatin AmericaLatviaLebanonLiberiaLithuaniaMalaysiaMexicoMicronesiaMiddle AfricaMoldovaMoroccoNepalNetherlandsNicaraguaNigeriaNorth AmericaNorth MacedoniaNorthern AfricaNorthern EuropeNorwayOceaniaPakistanPanamaPeruPhilippinesPolandPortugalRomaniaRussiaSaudi ArabiaScotlandSenegalSerbiaSierra LeoneSingaporeSomaliaSouth AfricaSouth AmericaSouth Central AsiaSouth Eastern AsiaSouthern EuropeSpainSri LankaSt. Vincent and the GrenadinesSudanSwedenSwitzerlandSyriaTaiwanThailandTrinidad and TobagoTurkeyUgandaUkraineUruguayUzbekistanVenezuelaVietnamWest IndiesWestern AfricaWestern AsiaWestern EuropeYemenZaireZimbabweAzores
2nd Grade
Income
Poverty
Unemployment
Labor Participation
Family Structure
Vehicle Availability
Education Level
Disability

2nd Grade Comparison

Bangladeshis

Immigrants from Bolivia

Tragic
Tragic
96.5%
2ND GRADE
0.0/ 100
METRIC RATING
332nd/ 347
METRIC RANK
97.4%
2ND GRADE
0.1/ 100
METRIC RATING
273rd/ 347
METRIC RANK

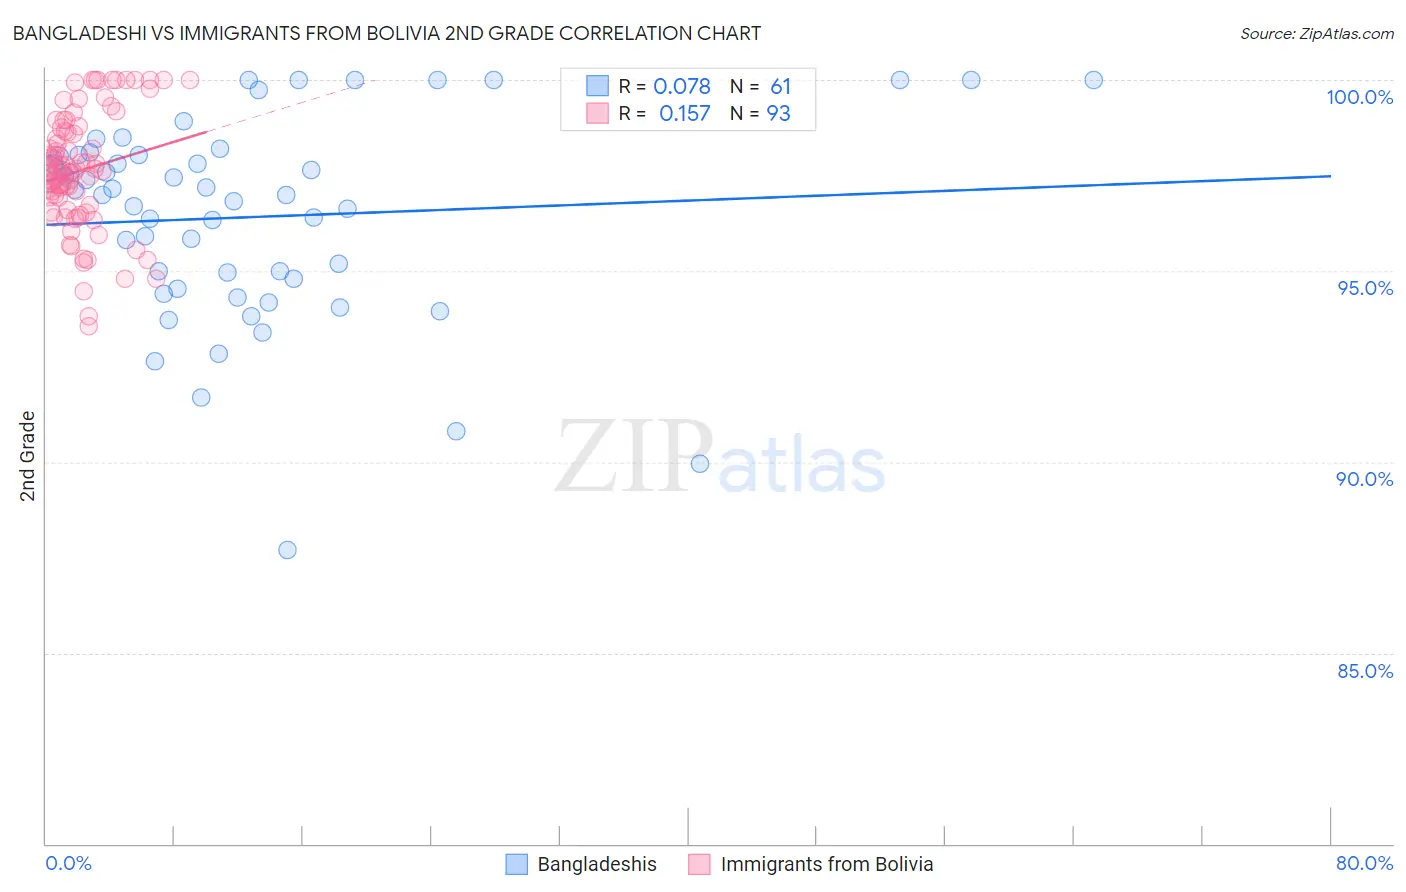
Bangladeshi vs Immigrants from Bolivia 2nd Grade Correlation Chart

The statistical analysis conducted on geographies consisting of 141,430,495 people shows a slight positive correlation between the proportion of Bangladeshis and percentage of population with at least 2nd grade education in the United States with a correlation coefficient (R) of 0.078 and weighted average of 96.5%. Similarly, the statistical analysis conducted on geographies consisting of 158,719,692 people shows a poor positive correlation between the proportion of Immigrants from Bolivia and percentage of population with at least 2nd grade education in the United States with a correlation coefficient (R) of 0.157 and weighted average of 97.4%, a difference of 0.92%.
Bangladeshi vs Immigrants from Bolivia 2nd Grade

2nd Grade Correlation Summary

MeasurementBangladeshiImmigrants from Bolivia
Minimum87.7%93.6%
Maximum100.0%100.0%
Range12.3%6.4%
Mean96.4%97.6%
Median97.0%97.6%
Interquartile 25% (IQ1)94.7%96.7%
Interquartile 75% (IQ3)98.0%98.7%
Interquartile Range (IQR)3.4%2.0%
Standard Deviation (Sample)2.6%1.5%
Standard Deviation (Population)2.6%1.5%

Similar Demographics by 2nd Grade

Demographics Similar to Bangladeshis by 2nd Grade

In terms of 2nd grade, the demographic groups most similar to Bangladeshis are Immigrants from Armenia (96.5%, a difference of 0.010%), Immigrants from Latin America (96.5%, a difference of 0.050%), Immigrants from Vietnam (96.5%, a difference of 0.060%), Mexican (96.5%, a difference of 0.060%), and Japanese (96.5%, a difference of 0.060%).
DemographicsRating | Rank2nd Grade
Dominicans
0.0
/100
|
#325
Tragic
96.6%
Immigrants | Honduras
0.0
/100
|
#326
Tragic
96.6%
Immigrants | Vietnam
0.0
/100
|
#327
Tragic
96.5%
Mexicans
0.0
/100
|
#328
Tragic
96.5%
Japanese
0.0
/100
|
#329
Tragic
96.5%
Immigrants | Latin America
0.0
/100
|
#330
Tragic
96.5%
Immigrants | Armenia
0.0
/100
|
#331
Tragic
96.5%
Bangladeshis
0.0
/100
|
#332
Tragic
96.5%
Immigrants | Dominican Republic
0.0
/100
|
#333
Tragic
96.4%
Central Americans
0.0
/100
|
#334
Tragic
96.4%
Yakama
0.0
/100
|
#335
Tragic
96.4%
Immigrants | Fiji
0.0
/100
|
#336
Tragic
96.4%
Immigrants | Cambodia
0.0
/100
|
#337
Tragic
96.4%
Immigrants | Cabo Verde
0.0
/100
|
#338
Tragic
96.3%
Guatemalans
0.0
/100
|
#339
Tragic
96.3%

Demographics Similar to Immigrants from Bolivia by 2nd Grade

In terms of 2nd grade, the demographic groups most similar to Immigrants from Bolivia are Immigrants from Peru (97.4%, a difference of 0.010%), Ghanaian (97.4%, a difference of 0.010%), Immigrants from China (97.3%, a difference of 0.010%), Immigrants from Cameroon (97.4%, a difference of 0.020%), and Immigrants from Jamaica (97.4%, a difference of 0.040%).
DemographicsRating | Rank2nd Grade
Immigrants | Sierra Leone
0.4
/100
|
#266
Tragic
97.4%
Cubans
0.3
/100
|
#267
Tragic
97.4%
Immigrants | Nigeria
0.3
/100
|
#268
Tragic
97.4%
West Indians
0.3
/100
|
#269
Tragic
97.4%
Immigrants | Jamaica
0.2
/100
|
#270
Tragic
97.4%
Immigrants | Cameroon
0.2
/100
|
#271
Tragic
97.4%
Immigrants | Peru
0.1
/100
|
#272
Tragic
97.4%
Immigrants | Bolivia
0.1
/100
|
#273
Tragic
97.4%
Ghanaians
0.1
/100
|
#274
Tragic
97.4%
Immigrants | China
0.1
/100
|
#275
Tragic
97.3%
Immigrants | Philippines
0.1
/100
|
#276
Tragic
97.3%
Immigrants | Western Africa
0.1
/100
|
#277
Tragic
97.3%
Immigrants | Uzbekistan
0.1
/100
|
#278
Tragic
97.3%
Immigrants | Ghana
0.1
/100
|
#279
Tragic
97.3%
Afghans
0.1
/100
|
#280
Tragic
97.3%