Latvian vs Czech No Schooling Completed
COMPARE
Latvian
Czech
No Schooling Completed
No Schooling Completed Comparison
Latvians
Czechs
1.5%
NO SCHOOLING COMPLETED
100.0/ 100
METRIC RATING
34th/ 347
METRIC RANK
1.5%
NO SCHOOLING COMPLETED
100.0/ 100
METRIC RATING
26th/ 347
METRIC RANK
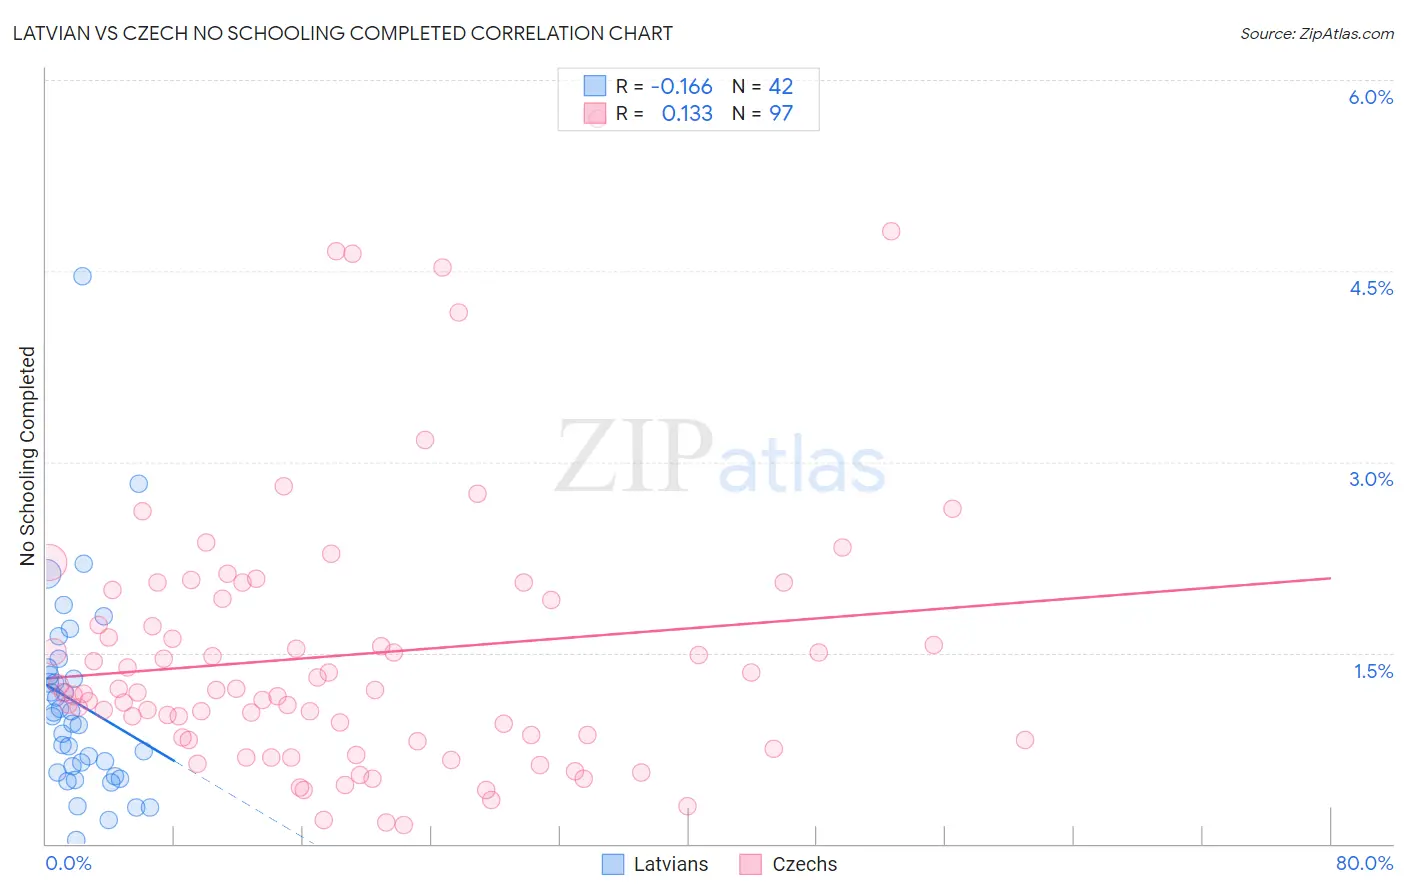
Latvian vs Czech No Schooling Completed Correlation Chart
The statistical analysis conducted on geographies consisting of 219,073,605 people shows a poor negative correlation between the proportion of Latvians and percentage of population with no schooling in the United States with a correlation coefficient (R) of -0.166 and weighted average of 1.5%. Similarly, the statistical analysis conducted on geographies consisting of 474,064,370 people shows a poor positive correlation between the proportion of Czechs and percentage of population with no schooling in the United States with a correlation coefficient (R) of 0.133 and weighted average of 1.5%, a difference of 3.3%.
No Schooling Completed Correlation Summary
| Measurement | Latvian | Czech |
| Minimum | 0.028% | 0.15% |
| Maximum | 4.5% | 5.7% |
| Range | 4.4% | 5.5% |
| Mean | 1.1% | 1.5% |
| Median | 0.97% | 1.2% |
| Interquartile 25% (IQ1) | 0.56% | 0.82% |
| Interquartile 75% (IQ3) | 1.3% | 1.9% |
| Interquartile Range (IQR) | 0.76% | 1.1% |
| Standard Deviation (Sample) | 0.80% | 1.1% |
| Standard Deviation (Population) | 0.79% | 1.1% |
Demographics Similar to Latvians and Czechs by No Schooling Completed
In terms of no schooling completed, the demographic groups most similar to Latvians are Italian (1.5%, a difference of 0.25%), Swiss (1.5%, a difference of 0.94%), Eastern European (1.6%, a difference of 0.95%), Inupiat (1.5%, a difference of 1.3%), and British (1.5%, a difference of 1.4%). Similarly, the demographic groups most similar to Czechs are Scandinavian (1.5%, a difference of 0.53%), French Canadian (1.5%, a difference of 0.54%), French (1.5%, a difference of 0.59%), Pennsylvania German (1.5%, a difference of 0.61%), and European (1.5%, a difference of 0.96%).
| Demographics | Rating | Rank | No Schooling Completed |
| Welsh | 100.0 /100 | #20 | Exceptional 1.5% |
| Chinese | 100.0 /100 | #21 | Exceptional 1.5% |
| Alaska Natives | 100.0 /100 | #22 | Exceptional 1.5% |
| Europeans | 100.0 /100 | #23 | Exceptional 1.5% |
| Pennsylvania Germans | 100.0 /100 | #24 | Exceptional 1.5% |
| French | 100.0 /100 | #25 | Exceptional 1.5% |
| Czechs | 100.0 /100 | #26 | Exceptional 1.5% |
| Scandinavians | 100.0 /100 | #27 | Exceptional 1.5% |
| French Canadians | 100.0 /100 | #28 | Exceptional 1.5% |
| Lumbee | 100.0 /100 | #29 | Exceptional 1.5% |
| British | 100.0 /100 | #30 | Exceptional 1.5% |
| Inupiat | 100.0 /100 | #31 | Exceptional 1.5% |
| Swiss | 100.0 /100 | #32 | Exceptional 1.5% |
| Italians | 100.0 /100 | #33 | Exceptional 1.5% |
| Latvians | 100.0 /100 | #34 | Exceptional 1.5% |
| Eastern Europeans | 100.0 /100 | #35 | Exceptional 1.6% |
| Aleuts | 99.9 /100 | #36 | Exceptional 1.6% |
| Belgians | 99.9 /100 | #37 | Exceptional 1.6% |
| Northern Europeans | 99.9 /100 | #38 | Exceptional 1.6% |
| Native Hawaiians | 99.9 /100 | #39 | Exceptional 1.6% |
| Luxembourgers | 99.9 /100 | #40 | Exceptional 1.6% |