Laotian vs English Associate's Degree
COMPARE
Laotian
English
Associate's Degree
Associate's Degree Comparison
Laotians
English
49.9%
ASSOCIATE'S DEGREE
98.4/ 100
METRIC RATING
94th/ 347
METRIC RANK
46.4%
ASSOCIATE'S DEGREE
50.0/ 100
METRIC RATING
174th/ 347
METRIC RANK
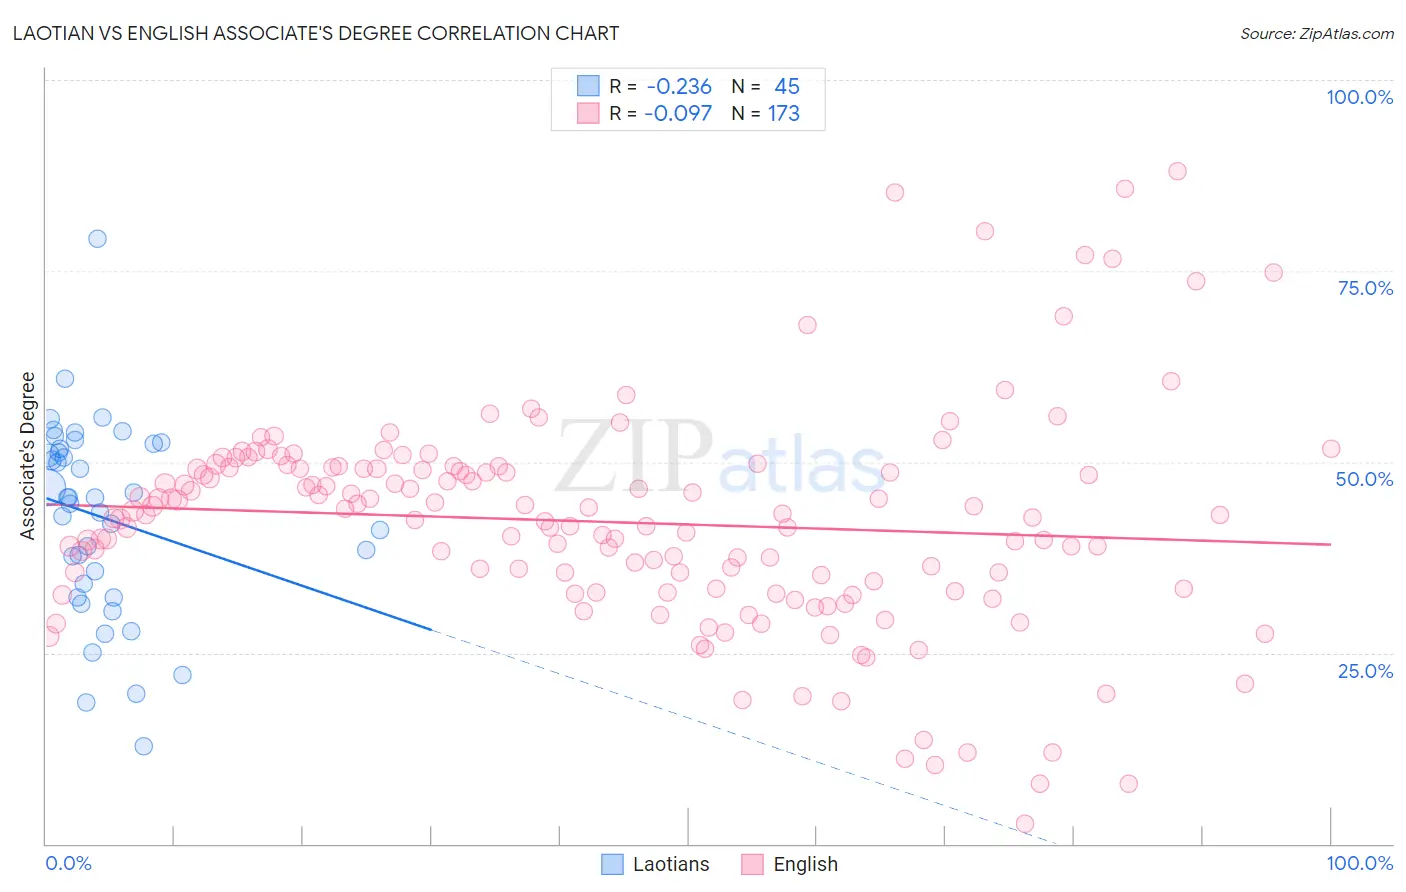
Laotian vs English Associate's Degree Correlation Chart
The statistical analysis conducted on geographies consisting of 224,847,979 people shows a weak negative correlation between the proportion of Laotians and percentage of population with at least associate's degree education in the United States with a correlation coefficient (R) of -0.236 and weighted average of 49.9%. Similarly, the statistical analysis conducted on geographies consisting of 579,836,667 people shows a slight negative correlation between the proportion of English and percentage of population with at least associate's degree education in the United States with a correlation coefficient (R) of -0.097 and weighted average of 46.4%, a difference of 7.7%.
Associate's Degree Correlation Summary
| Measurement | Laotian | English |
| Minimum | 12.7% | 2.6% |
| Maximum | 79.2% | 88.0% |
| Range | 66.5% | 85.4% |
| Mean | 42.7% | 42.1% |
| Median | 45.3% | 43.1% |
| Interquartile 25% (IQ1) | 33.2% | 33.3% |
| Interquartile 75% (IQ3) | 52.1% | 49.2% |
| Interquartile Range (IQR) | 18.9% | 15.8% |
| Standard Deviation (Sample) | 12.8% | 14.2% |
| Standard Deviation (Population) | 12.6% | 14.2% |
Similar Demographics by Associate's Degree
Demographics Similar to Laotians by Associate's Degree
In terms of associate's degree, the demographic groups most similar to Laotians are Immigrants from Brazil (50.0%, a difference of 0.13%), Immigrants from North America (50.1%, a difference of 0.28%), Immigrants from Western Asia (50.1%, a difference of 0.31%), Immigrants from Western Europe (50.1%, a difference of 0.39%), and Immigrants from Ethiopia (50.1%, a difference of 0.39%).
| Demographics | Rating | Rank | Associate's Degree |
| Immigrants | Moldova | 98.8 /100 | #87 | Exceptional 50.2% |
| Immigrants | Canada | 98.7 /100 | #88 | Exceptional 50.1% |
| Immigrants | Western Europe | 98.7 /100 | #89 | Exceptional 50.1% |
| Immigrants | Ethiopia | 98.7 /100 | #90 | Exceptional 50.1% |
| Immigrants | Western Asia | 98.7 /100 | #91 | Exceptional 50.1% |
| Immigrants | North America | 98.7 /100 | #92 | Exceptional 50.1% |
| Immigrants | Brazil | 98.5 /100 | #93 | Exceptional 50.0% |
| Laotians | 98.4 /100 | #94 | Exceptional 49.9% |
| Immigrants | England | 98.0 /100 | #95 | Exceptional 49.7% |
| Romanians | 98.0 /100 | #96 | Exceptional 49.7% |
| Immigrants | Ukraine | 98.0 /100 | #97 | Exceptional 49.7% |
| Immigrants | Northern Africa | 97.9 /100 | #98 | Exceptional 49.7% |
| Macedonians | 97.8 /100 | #99 | Exceptional 49.6% |
| Immigrants | Nepal | 97.5 /100 | #100 | Exceptional 49.5% |
| Northern Europeans | 97.3 /100 | #101 | Exceptional 49.5% |
Demographics Similar to English by Associate's Degree
In terms of associate's degree, the demographic groups most similar to English are Immigrants from Iraq (46.4%, a difference of 0.020%), Peruvian (46.4%, a difference of 0.040%), Belgian (46.3%, a difference of 0.090%), Finnish (46.3%, a difference of 0.11%), and Slovak (46.3%, a difference of 0.12%).
| Demographics | Rating | Rank | Associate's Degree |
| Immigrants | Sierra Leone | 59.2 /100 | #167 | Average 46.7% |
| Immigrants | Somalia | 55.5 /100 | #168 | Average 46.5% |
| Uruguayans | 55.4 /100 | #169 | Average 46.5% |
| Irish | 53.6 /100 | #170 | Average 46.5% |
| Basques | 52.8 /100 | #171 | Average 46.5% |
| Peruvians | 50.5 /100 | #172 | Average 46.4% |
| Immigrants | Iraq | 50.3 /100 | #173 | Average 46.4% |
| English | 50.0 /100 | #174 | Average 46.4% |
| Belgians | 48.9 /100 | #175 | Average 46.3% |
| Finns | 48.5 /100 | #176 | Average 46.3% |
| Slovaks | 48.4 /100 | #177 | Average 46.3% |
| Immigrants | Bosnia and Herzegovina | 48.3 /100 | #178 | Average 46.3% |
| Sri Lankans | 47.6 /100 | #179 | Average 46.3% |
| Bermudans | 46.4 /100 | #180 | Average 46.2% |
| Immigrants | Colombia | 41.3 /100 | #181 | Average 46.0% |