Kiowa vs Immigrants from St. Vincent and the Grenadines Bachelor's Degree
COMPARE
Kiowa
Immigrants from St. Vincent and the Grenadines
Bachelor's Degree
Bachelor's Degree Comparison
Kiowa
Immigrants from St. Vincent and the Grenadines
28.8%
BACHELOR'S DEGREE
0.0/ 100
METRIC RATING
320th/ 347
METRIC RANK
35.0%
BACHELOR'S DEGREE
4.3/ 100
METRIC RATING
231st/ 347
METRIC RANK
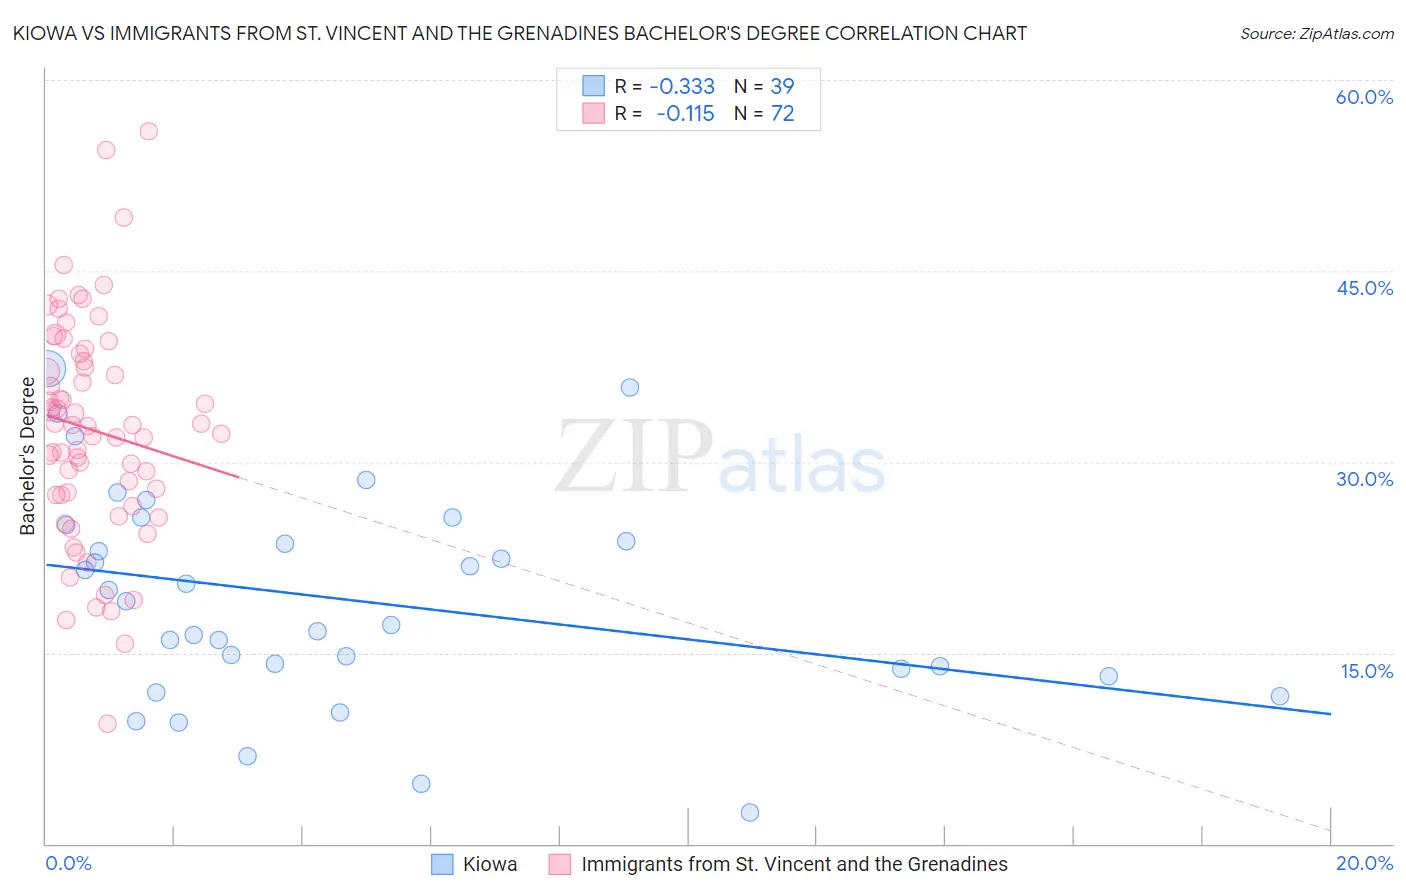
Kiowa vs Immigrants from St. Vincent and the Grenadines Bachelor's Degree Correlation Chart
The statistical analysis conducted on geographies consisting of 56,101,363 people shows a mild negative correlation between the proportion of Kiowa and percentage of population with at least bachelor's degree education in the United States with a correlation coefficient (R) of -0.333 and weighted average of 28.8%. Similarly, the statistical analysis conducted on geographies consisting of 56,189,778 people shows a poor negative correlation between the proportion of Immigrants from St. Vincent and the Grenadines and percentage of population with at least bachelor's degree education in the United States with a correlation coefficient (R) of -0.115 and weighted average of 35.0%, a difference of 21.2%.
Bachelor's Degree Correlation Summary
| Measurement | Kiowa | Immigrants from St. Vincent and the Grenadines |
| Minimum | 2.5% | 9.4% |
| Maximum | 37.3% | 56.0% |
| Range | 34.8% | 46.6% |
| Mean | 19.2% | 32.5% |
| Median | 19.1% | 32.9% |
| Interquartile 25% (IQ1) | 13.7% | 27.4% |
| Interquartile 75% (IQ3) | 25.1% | 38.2% |
| Interquartile Range (IQR) | 11.4% | 10.7% |
| Standard Deviation (Sample) | 8.3% | 8.7% |
| Standard Deviation (Population) | 8.2% | 8.7% |
Similar Demographics by Bachelor's Degree
Demographics Similar to Kiowa by Bachelor's Degree
In terms of bachelor's degree, the demographic groups most similar to Kiowa are Creek (28.9%, a difference of 0.040%), Alaskan Athabascan (28.8%, a difference of 0.080%), Tsimshian (28.8%, a difference of 0.30%), Fijian (28.7%, a difference of 0.44%), and Yaqui (29.0%, a difference of 0.50%).
| Demographics | Rating | Rank | Bachelor's Degree |
| Alaska Natives | 0.0 /100 | #313 | Tragic 29.4% |
| Shoshone | 0.0 /100 | #314 | Tragic 29.3% |
| Immigrants | Cabo Verde | 0.0 /100 | #315 | Tragic 29.2% |
| Sioux | 0.0 /100 | #316 | Tragic 29.1% |
| Colville | 0.0 /100 | #317 | Tragic 29.0% |
| Yaqui | 0.0 /100 | #318 | Tragic 29.0% |
| Creek | 0.0 /100 | #319 | Tragic 28.9% |
| Kiowa | 0.0 /100 | #320 | Tragic 28.8% |
| Alaskan Athabascans | 0.0 /100 | #321 | Tragic 28.8% |
| Tsimshian | 0.0 /100 | #322 | Tragic 28.8% |
| Fijians | 0.0 /100 | #323 | Tragic 28.7% |
| Dutch West Indians | 0.0 /100 | #324 | Tragic 28.5% |
| Pennsylvania Germans | 0.0 /100 | #325 | Tragic 28.4% |
| Apache | 0.0 /100 | #326 | Tragic 28.3% |
| Paiute | 0.0 /100 | #327 | Tragic 28.1% |
Demographics Similar to Immigrants from St. Vincent and the Grenadines by Bachelor's Degree
In terms of bachelor's degree, the demographic groups most similar to Immigrants from St. Vincent and the Grenadines are Immigrants from Grenada (35.0%, a difference of 0.020%), Hmong (34.8%, a difference of 0.63%), Immigrants from Ecuador (34.7%, a difference of 0.74%), White/Caucasian (35.3%, a difference of 0.87%), and Immigrants from Trinidad and Tobago (35.3%, a difference of 0.95%).
| Demographics | Rating | Rank | Bachelor's Degree |
| Immigrants | Barbados | 7.5 /100 | #224 | Tragic 35.5% |
| Immigrants | Burma/Myanmar | 7.3 /100 | #225 | Tragic 35.5% |
| Portuguese | 7.2 /100 | #226 | Tragic 35.5% |
| Ecuadorians | 6.6 /100 | #227 | Tragic 35.4% |
| Immigrants | Trinidad and Tobago | 6.0 /100 | #228 | Tragic 35.3% |
| Whites/Caucasians | 5.9 /100 | #229 | Tragic 35.3% |
| Immigrants | Grenada | 4.3 /100 | #230 | Tragic 35.0% |
| Immigrants | St. Vincent and the Grenadines | 4.3 /100 | #231 | Tragic 35.0% |
| Hmong | 3.4 /100 | #232 | Tragic 34.8% |
| Immigrants | Ecuador | 3.3 /100 | #233 | Tragic 34.7% |
| Guamanians/Chamorros | 3.0 /100 | #234 | Tragic 34.6% |
| Immigrants | West Indies | 2.9 /100 | #235 | Tragic 34.6% |
| Liberians | 2.8 /100 | #236 | Tragic 34.6% |
| Tlingit-Haida | 2.8 /100 | #237 | Tragic 34.6% |
| Guyanese | 2.5 /100 | #238 | Tragic 34.5% |