Delaware vs Immigrants from St. Vincent and the Grenadines Bachelor's Degree
COMPARE
Delaware
Immigrants from St. Vincent and the Grenadines
Bachelor's Degree
Bachelor's Degree Comparison
Delaware
Immigrants from St. Vincent and the Grenadines
33.8%
BACHELOR'S DEGREE
1.2/ 100
METRIC RATING
244th/ 347
METRIC RANK
35.0%
BACHELOR'S DEGREE
4.3/ 100
METRIC RATING
231st/ 347
METRIC RANK
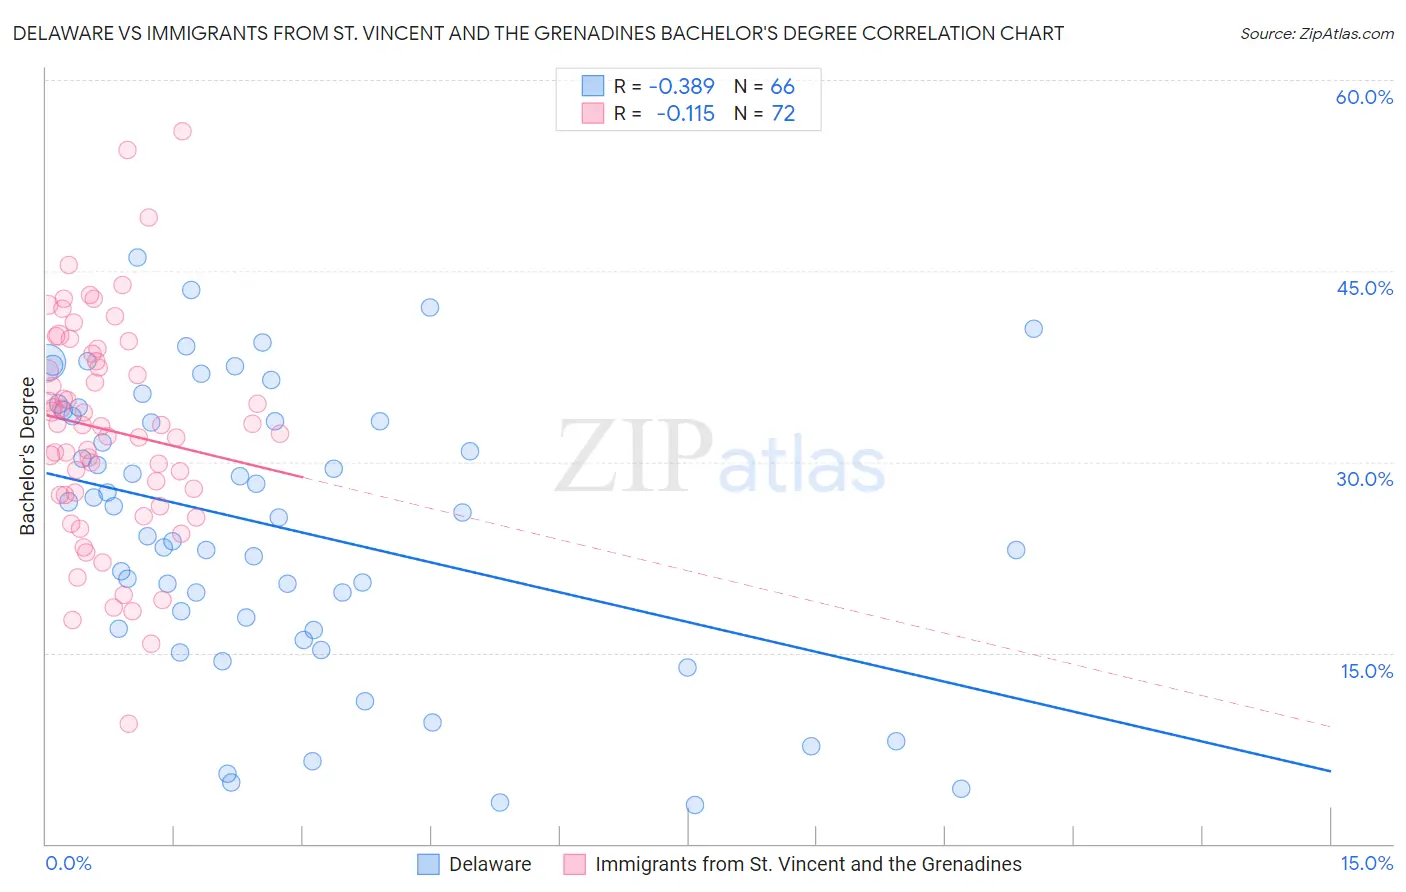
Delaware vs Immigrants from St. Vincent and the Grenadines Bachelor's Degree Correlation Chart
The statistical analysis conducted on geographies consisting of 96,234,889 people shows a mild negative correlation between the proportion of Delaware and percentage of population with at least bachelor's degree education in the United States with a correlation coefficient (R) of -0.389 and weighted average of 33.8%. Similarly, the statistical analysis conducted on geographies consisting of 56,189,778 people shows a poor negative correlation between the proportion of Immigrants from St. Vincent and the Grenadines and percentage of population with at least bachelor's degree education in the United States with a correlation coefficient (R) of -0.115 and weighted average of 35.0%, a difference of 3.5%.
Bachelor's Degree Correlation Summary
| Measurement | Delaware | Immigrants from St. Vincent and the Grenadines |
| Minimum | 3.0% | 9.4% |
| Maximum | 46.1% | 56.0% |
| Range | 43.0% | 46.6% |
| Mean | 24.8% | 32.5% |
| Median | 25.8% | 32.9% |
| Interquartile 25% (IQ1) | 16.9% | 27.4% |
| Interquartile 75% (IQ3) | 33.6% | 38.2% |
| Interquartile Range (IQR) | 16.7% | 10.7% |
| Standard Deviation (Sample) | 11.0% | 8.7% |
| Standard Deviation (Population) | 11.0% | 8.7% |
Demographics Similar to Delaware and Immigrants from St. Vincent and the Grenadines by Bachelor's Degree
In terms of bachelor's degree, the demographic groups most similar to Delaware are Immigrants from Fiji (33.7%, a difference of 0.090%), Jamaican (33.6%, a difference of 0.45%), Immigrants from Guyana (33.9%, a difference of 0.50%), Immigrants from Congo (33.6%, a difference of 0.54%), and Nonimmigrants (34.2%, a difference of 1.1%). Similarly, the demographic groups most similar to Immigrants from St. Vincent and the Grenadines are Immigrants from Grenada (35.0%, a difference of 0.020%), Hmong (34.8%, a difference of 0.63%), Immigrants from Ecuador (34.7%, a difference of 0.74%), White/Caucasian (35.3%, a difference of 0.87%), and Immigrants from Trinidad and Tobago (35.3%, a difference of 0.95%).
| Demographics | Rating | Rank | Bachelor's Degree |
| Ecuadorians | 6.6 /100 | #227 | Tragic 35.4% |
| Immigrants | Trinidad and Tobago | 6.0 /100 | #228 | Tragic 35.3% |
| Whites/Caucasians | 5.9 /100 | #229 | Tragic 35.3% |
| Immigrants | Grenada | 4.3 /100 | #230 | Tragic 35.0% |
| Immigrants | St. Vincent and the Grenadines | 4.3 /100 | #231 | Tragic 35.0% |
| Hmong | 3.4 /100 | #232 | Tragic 34.8% |
| Immigrants | Ecuador | 3.3 /100 | #233 | Tragic 34.7% |
| Guamanians/Chamorros | 3.0 /100 | #234 | Tragic 34.6% |
| Immigrants | West Indies | 2.9 /100 | #235 | Tragic 34.6% |
| Liberians | 2.8 /100 | #236 | Tragic 34.6% |
| Tlingit-Haida | 2.8 /100 | #237 | Tragic 34.6% |
| Guyanese | 2.5 /100 | #238 | Tragic 34.5% |
| British West Indians | 2.5 /100 | #239 | Tragic 34.5% |
| Tongans | 2.0 /100 | #240 | Tragic 34.3% |
| Immigrants | Cambodia | 1.9 /100 | #241 | Tragic 34.2% |
| Immigrants | Nonimmigrants | 1.8 /100 | #242 | Tragic 34.2% |
| Immigrants | Guyana | 1.4 /100 | #243 | Tragic 33.9% |
| Delaware | 1.2 /100 | #244 | Tragic 33.8% |
| Immigrants | Fiji | 1.2 /100 | #245 | Tragic 33.7% |
| Jamaicans | 1.0 /100 | #246 | Tragic 33.6% |
| Immigrants | Congo | 1.0 /100 | #247 | Tragic 33.6% |