Kenyan vs Immigrants from Burma/Myanmar Bachelor's Degree

COMPARE

Kenyan
Race
Ancestry
AfghanAfricanAlaska NativeAlaskan AthabascanAlbanianAleutAlsatianAmericanApacheArabArapahoArgentineanArmenianAssyrian/Chaldean/SyriacAustralianAustrianBahamianBangladeshiBarbadianBasqueBelgianBelizeanBermudanBhutaneseBlackfeetBolivianBrazilianBritishBritish West IndianBulgarianBurmeseCajunCambodianCanadianCape VerdeanCarpatho RusynCelticCentral AmericanCentral American IndianCherokeeCheyenneChickasawChileanChineseChippewaChoctawColombianColvilleComancheCosta RicanCreeCreekCroatianCrowCubanCypriotCzechCzechoslovakianDanishDelawareDominicanDutchDutch West IndianEastern EuropeanEcuadorianEgyptianEnglishEstonianEthiopianEuropeanFijianFilipinoFinnishFrenchFrench American IndianFrench CanadianGermanGerman RussianGhanaianGreekGuamanian/ChamorroGuatemalanGuyaneseHaitianHmongHonduranHopiHoumaHungarianIcelanderIndian (Asian)IndonesianInupiatIranianIraqiIrishIroquoisIsraeliItalianJamaicanJapaneseJordanianKenyanKiowaKoreanLaotianLatvianLebaneseLiberianLithuanianLumbeeLuxembourgerMacedonianMalaysianMalteseMarshalleseMenomineeMexicanMexican American IndianMongolianMoroccanNative HawaiianNavajoNepaleseNew ZealanderNicaraguanNigerianNorthern EuropeanNorwegianOkinawanOsageOttawaPaiutePakistaniPalestinianPanamanianParaguayanPennsylvania GermanPeruvianPimaPolishPortuguesePotawatomiPuebloPuerto RicanPuget Sound SalishRomanianRussianSalvadoranSamoanScandinavianScotch-IrishScottishSeminoleSenegaleseSerbianShoshoneSierra LeoneanSiouxSlavicSlovakSloveneSomaliSouth AfricanSouth AmericanSouth American IndianSoviet UnionSpaniardSpanishSpanish AmericanSpanish American IndianSri LankanSubsaharan AfricanSudaneseSwedishSwissSyrianTaiwaneseThaiTlingit-HaidaTohono O'OdhamTonganTrinidadian and TobagonianTsimshianTurkishU.S. Virgin IslanderUgandanUkrainianUruguayanUteVenezuelanVietnameseWelshWest IndianYakamaYaquiYugoslavianYumanYup'ikZimbabwean
Immigration
NonimmigrantsImmigrantsAfghanistanAfricaAlbaniaArgentinaArmeniaAsiaAustraliaAustriaBahamasBangladeshBarbadosBelarusBelgiumBelizeBoliviaBosnia and HerzegovinaBrazilBulgariaCabo VerdeCambodiaCameroonCanadaCaribbeanCentral AmericaChileChinaColombiaCongoCosta RicaCroatiaCubaCzechoslovakiaDenmarkDominicaDominican RepublicEastern AfricaEastern AsiaEastern EuropeEcuadorEgyptEl SalvadorEnglandEritreaEthiopiaEuropeFijiFranceGermanyGhanaGreeceGrenadaGuatemalaGuyanaHaitiHondurasHong KongHungaryIndiaIndonesiaIranIraqIrelandIsraelItalyJamaicaJapanJordanKazakhstanKenyaKoreaKuwaitLaosLatin AmericaLatviaLebanonLiberiaLithuaniaMalaysiaMexicoMicronesiaMiddle AfricaMoldovaMoroccoNepalNetherlandsNicaraguaNigeriaNorth AmericaNorth MacedoniaNorthern AfricaNorthern EuropeNorwayOceaniaPakistanPanamaPeruPhilippinesPolandPortugalRomaniaRussiaSaudi ArabiaScotlandSenegalSerbiaSierra LeoneSingaporeSomaliaSouth AfricaSouth AmericaSouth Central AsiaSouth Eastern AsiaSouthern EuropeSpainSri LankaSt. Vincent and the GrenadinesSudanSwedenSwitzerlandSyriaTaiwanThailandTrinidad and TobagoTurkeyUgandaUkraineUruguayUzbekistanVenezuelaVietnamWest IndiesWestern AfricaWestern AsiaWestern EuropeYemenZaireZimbabweAzores
Immigrants from Burma/Myanmar
Race
Ancestry
AfghanAfricanAlaska NativeAlaskan AthabascanAlbanianAleutAlsatianAmericanApacheArabArapahoArgentineanArmenianAssyrian/Chaldean/SyriacAustralianAustrianBahamianBangladeshiBarbadianBasqueBelgianBelizeanBermudanBhutaneseBlackfeetBolivianBrazilianBritishBritish West IndianBulgarianBurmeseCajunCambodianCanadianCape VerdeanCarpatho RusynCelticCentral AmericanCentral American IndianCherokeeCheyenneChickasawChileanChineseChippewaChoctawColombianColvilleComancheCosta RicanCreeCreekCroatianCrowCubanCypriotCzechCzechoslovakianDanishDelawareDominicanDutchDutch West IndianEastern EuropeanEcuadorianEgyptianEnglishEstonianEthiopianEuropeanFijianFilipinoFinnishFrenchFrench American IndianFrench CanadianGermanGerman RussianGhanaianGreekGuamanian/ChamorroGuatemalanGuyaneseHaitianHmongHonduranHopiHoumaHungarianIcelanderIndian (Asian)IndonesianInupiatIranianIraqiIrishIroquoisIsraeliItalianJamaicanJapaneseJordanianKiowaKoreanLaotianLatvianLebaneseLiberianLithuanianLumbeeLuxembourgerMacedonianMalaysianMalteseMarshalleseMenomineeMexicanMexican American IndianMongolianMoroccanNative HawaiianNavajoNepaleseNew ZealanderNicaraguanNigerianNorthern EuropeanNorwegianOkinawanOsageOttawaPaiutePakistaniPalestinianPanamanianParaguayanPennsylvania GermanPeruvianPimaPolishPortuguesePotawatomiPuebloPuerto RicanPuget Sound SalishRomanianRussianSalvadoranSamoanScandinavianScotch-IrishScottishSeminoleSenegaleseSerbianShoshoneSierra LeoneanSiouxSlavicSlovakSloveneSomaliSouth AfricanSouth AmericanSouth American IndianSoviet UnionSpaniardSpanishSpanish AmericanSpanish American IndianSri LankanSubsaharan AfricanSudaneseSwedishSwissSyrianTaiwaneseThaiTlingit-HaidaTohono O'OdhamTonganTrinidadian and TobagonianTsimshianTurkishU.S. Virgin IslanderUgandanUkrainianUruguayanUteVenezuelanVietnameseWelshWest IndianYakamaYaquiYugoslavianYumanYup'ikZimbabwean
Immigration
NonimmigrantsImmigrantsAfghanistanAfricaAlbaniaArgentinaArmeniaAsiaAustraliaAustriaBahamasBangladeshBarbadosBelarusBelgiumBelizeBoliviaBosnia and HerzegovinaBrazilBulgariaBurma/MyanmarCabo VerdeCambodiaCameroonCanadaCaribbeanCentral AmericaChileChinaColombiaCongoCosta RicaCroatiaCubaCzechoslovakiaDenmarkDominicaDominican RepublicEastern AfricaEastern AsiaEastern EuropeEcuadorEgyptEl SalvadorEnglandEritreaEthiopiaEuropeFijiFranceGermanyGhanaGreeceGrenadaGuatemalaGuyanaHaitiHondurasHong KongHungaryIndiaIndonesiaIranIraqIrelandIsraelItalyJamaicaJapanJordanKazakhstanKenyaKoreaKuwaitLaosLatin AmericaLatviaLebanonLiberiaLithuaniaMalaysiaMexicoMicronesiaMiddle AfricaMoldovaMoroccoNepalNetherlandsNicaraguaNigeriaNorth AmericaNorth MacedoniaNorthern AfricaNorthern EuropeNorwayOceaniaPakistanPanamaPeruPhilippinesPolandPortugalRomaniaRussiaSaudi ArabiaScotlandSenegalSerbiaSierra LeoneSingaporeSomaliaSouth AfricaSouth AmericaSouth Central AsiaSouth Eastern AsiaSouthern EuropeSpainSri LankaSt. Vincent and the GrenadinesSudanSwedenSwitzerlandSyriaTaiwanThailandTrinidad and TobagoTurkeyUgandaUkraineUruguayUzbekistanVenezuelaVietnamWest IndiesWestern AfricaWestern AsiaWestern EuropeYemenZaireZimbabweAzores
Bachelor's Degree
Income
Poverty
Unemployment
Labor Participation
Family Structure
Vehicle Availability
Education Level
Disability

Bachelor's Degree Comparison

Kenyans

Immigrants from Burma/Myanmar

Good
Tragic
38.7%
BACHELOR'S DEGREE
72.5/ 100
METRIC RATING
156th/ 347
METRIC RANK
35.5%
BACHELOR'S DEGREE
7.3/ 100
METRIC RATING
225th/ 347
METRIC RANK

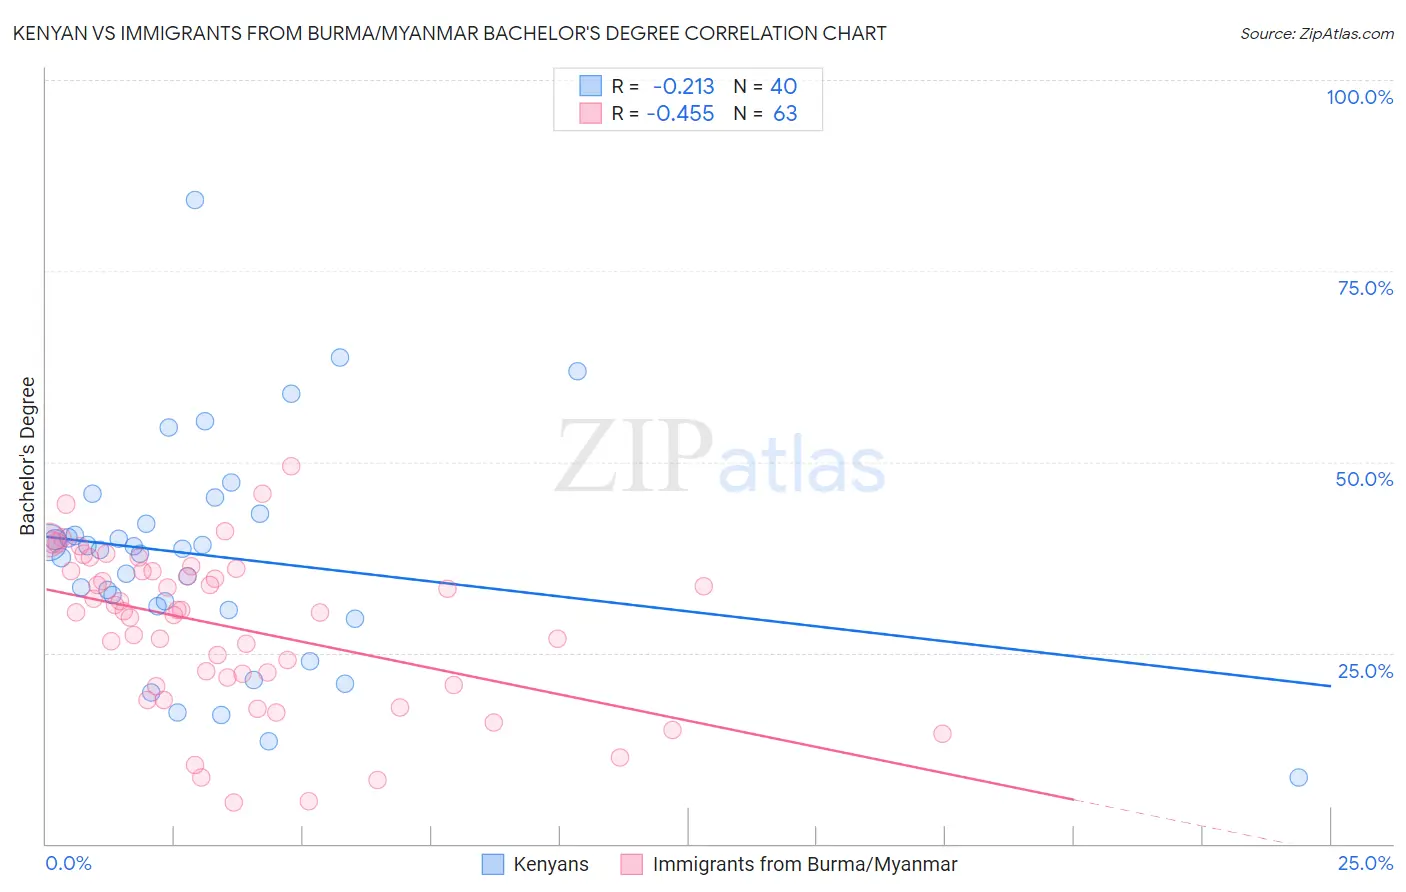
Kenyan vs Immigrants from Burma/Myanmar Bachelor's Degree Correlation Chart

The statistical analysis conducted on geographies consisting of 168,237,785 people shows a weak negative correlation between the proportion of Kenyans and percentage of population with at least bachelor's degree education in the United States with a correlation coefficient (R) of -0.213 and weighted average of 38.7%. Similarly, the statistical analysis conducted on geographies consisting of 172,337,344 people shows a moderate negative correlation between the proportion of Immigrants from Burma/Myanmar and percentage of population with at least bachelor's degree education in the United States with a correlation coefficient (R) of -0.455 and weighted average of 35.5%, a difference of 9.1%.
Kenyan vs Immigrants from Burma/Myanmar Bachelor's Degree

Bachelor's Degree Correlation Summary

MeasurementKenyanImmigrants from Burma/Myanmar
Minimum8.7%5.5%
Maximum84.3%49.5%
Range75.6%44.0%
Mean37.6%28.4%
Median38.6%30.5%
Interquartile 25% (IQ1)30.8%20.8%
Interquartile 75% (IQ3)42.5%35.8%
Interquartile Range (IQR)11.7%15.0%
Standard Deviation (Sample)14.7%10.3%
Standard Deviation (Population)14.5%10.2%

Similar Demographics by Bachelor's Degree

Demographics Similar to Kenyans by Bachelor's Degree

In terms of bachelor's degree, the demographic groups most similar to Kenyans are Immigrants from Kenya (38.8%, a difference of 0.15%), Immigrants from South America (38.6%, a difference of 0.28%), Canadian (38.8%, a difference of 0.31%), Immigrants from Germany (38.6%, a difference of 0.34%), and Slavic (38.9%, a difference of 0.42%).
DemographicsRating | RankBachelor's Degree
Immigrants | Poland
77.5
/100
|
#149
Good
39.0%
South Americans
77.3
/100
|
#150
Good
38.9%
Immigrants | Africa
76.5
/100
|
#151
Good
38.9%
Sudanese
76.4
/100
|
#152
Good
38.9%
Slavs
75.9
/100
|
#153
Good
38.9%
Canadians
75.0
/100
|
#154
Good
38.8%
Immigrants | Kenya
73.8
/100
|
#155
Good
38.8%
Kenyans
72.5
/100
|
#156
Good
38.7%
Immigrants | South America
70.1
/100
|
#157
Good
38.6%
Immigrants | Germany
69.6
/100
|
#158
Good
38.6%
Chinese
66.6
/100
|
#159
Good
38.5%
Vietnamese
66.6
/100
|
#160
Good
38.5%
Uruguayans
65.8
/100
|
#161
Good
38.4%
Colombians
65.0
/100
|
#162
Good
38.4%
Peruvians
63.4
/100
|
#163
Good
38.3%

Demographics Similar to Immigrants from Burma/Myanmar by Bachelor's Degree

In terms of bachelor's degree, the demographic groups most similar to Immigrants from Burma/Myanmar are Portuguese (35.5%, a difference of 0.040%), Immigrants from Barbados (35.5%, a difference of 0.070%), Ecuadorian (35.4%, a difference of 0.30%), French Canadian (35.6%, a difference of 0.35%), and Trinidadian and Tobagonian (35.7%, a difference of 0.52%).
DemographicsRating | RankBachelor's Degree
Sub-Saharan Africans
9.8
/100
|
#218
Tragic
35.8%
West Indians
9.7
/100
|
#219
Tragic
35.8%
Spanish
9.6
/100
|
#220
Tragic
35.8%
Dutch
9.2
/100
|
#221
Tragic
35.7%
Trinidadians and Tobagonians
8.8
/100
|
#222
Tragic
35.7%
French Canadians
8.3
/100
|
#223
Tragic
35.6%
Immigrants | Barbados
7.5
/100
|
#224
Tragic
35.5%
Immigrants | Burma/Myanmar
7.3
/100
|
#225
Tragic
35.5%
Portuguese
7.2
/100
|
#226
Tragic
35.5%
Ecuadorians
6.6
/100
|
#227
Tragic
35.4%
Immigrants | Trinidad and Tobago
6.0
/100
|
#228
Tragic
35.3%
Whites/Caucasians
5.9
/100
|
#229
Tragic
35.3%
Immigrants | Grenada
4.3
/100
|
#230
Tragic
35.0%
Immigrants | St. Vincent and the Grenadines
4.3
/100
|
#231
Tragic
35.0%
Hmong
3.4
/100
|
#232
Tragic
34.8%