Immigrants from Cambodia vs Immigrants from Burma/Myanmar Bachelor's Degree
COMPARE
Immigrants from Cambodia
Immigrants from Burma/Myanmar
Bachelor's Degree
Bachelor's Degree Comparison
Immigrants from Cambodia
Immigrants from Burma/Myanmar
34.2%
BACHELOR'S DEGREE
1.9/ 100
METRIC RATING
241st/ 347
METRIC RANK
35.5%
BACHELOR'S DEGREE
7.3/ 100
METRIC RATING
225th/ 347
METRIC RANK
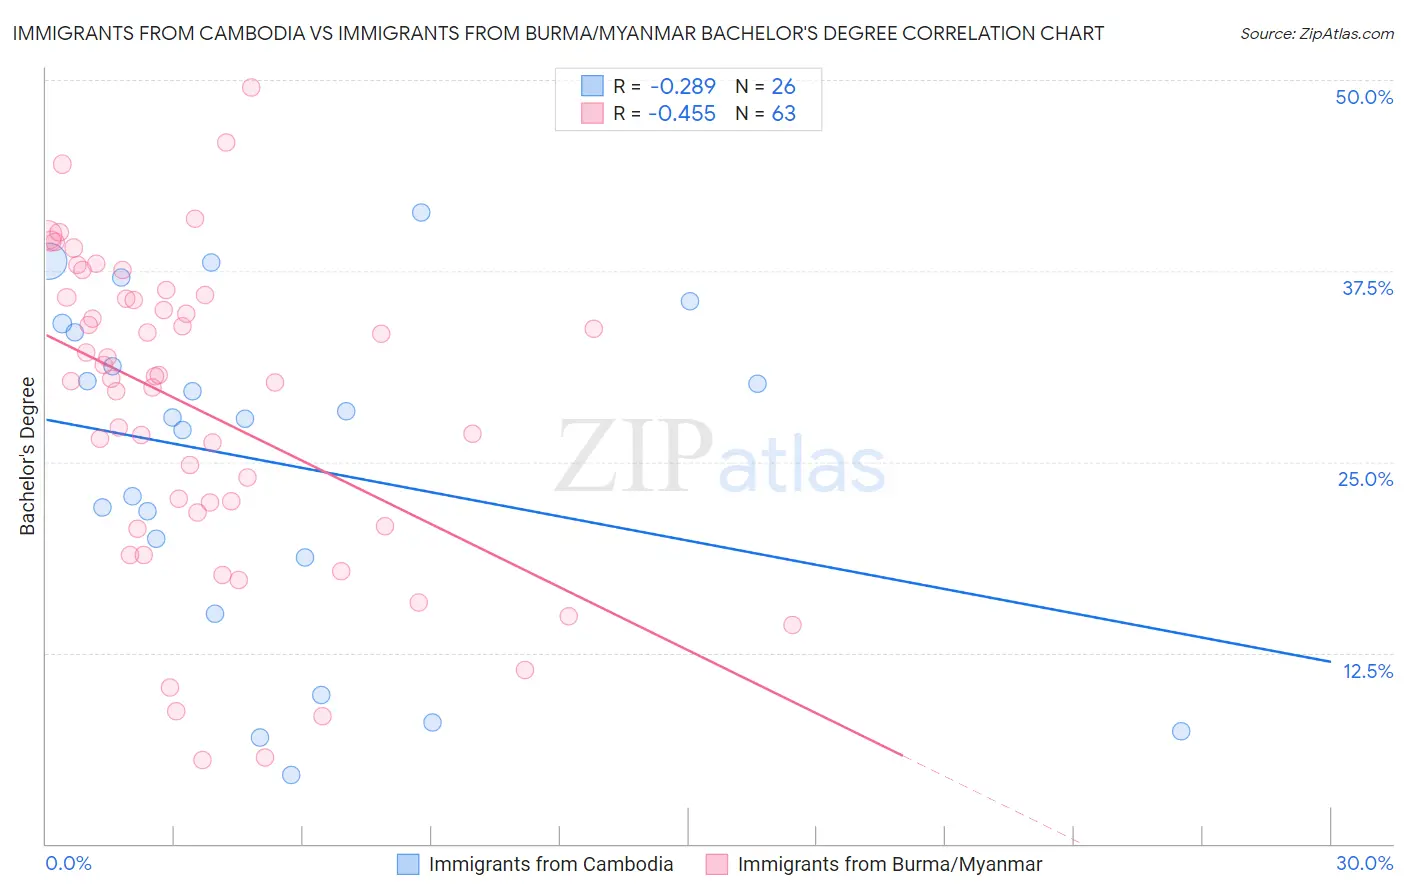
Immigrants from Cambodia vs Immigrants from Burma/Myanmar Bachelor's Degree Correlation Chart
The statistical analysis conducted on geographies consisting of 205,152,160 people shows a weak negative correlation between the proportion of Immigrants from Cambodia and percentage of population with at least bachelor's degree education in the United States with a correlation coefficient (R) of -0.289 and weighted average of 34.2%. Similarly, the statistical analysis conducted on geographies consisting of 172,337,344 people shows a moderate negative correlation between the proportion of Immigrants from Burma/Myanmar and percentage of population with at least bachelor's degree education in the United States with a correlation coefficient (R) of -0.455 and weighted average of 35.5%, a difference of 3.8%.
Bachelor's Degree Correlation Summary
| Measurement | Immigrants from Cambodia | Immigrants from Burma/Myanmar |
| Minimum | 4.5% | 5.5% |
| Maximum | 41.4% | 49.5% |
| Range | 36.9% | 44.0% |
| Mean | 24.9% | 28.4% |
| Median | 27.9% | 30.5% |
| Interquartile 25% (IQ1) | 18.8% | 20.8% |
| Interquartile 75% (IQ3) | 33.5% | 35.8% |
| Interquartile Range (IQR) | 14.7% | 15.0% |
| Standard Deviation (Sample) | 10.8% | 10.3% |
| Standard Deviation (Population) | 10.6% | 10.2% |
Demographics Similar to Immigrants from Cambodia and Immigrants from Burma/Myanmar by Bachelor's Degree
In terms of bachelor's degree, the demographic groups most similar to Immigrants from Cambodia are Nonimmigrants (34.2%, a difference of 0.060%), Tongan (34.3%, a difference of 0.26%), Immigrants from Guyana (33.9%, a difference of 0.71%), British West Indian (34.5%, a difference of 0.80%), and Guyanese (34.5%, a difference of 0.82%). Similarly, the demographic groups most similar to Immigrants from Burma/Myanmar are Portuguese (35.5%, a difference of 0.040%), Immigrants from Barbados (35.5%, a difference of 0.070%), Ecuadorian (35.4%, a difference of 0.30%), French Canadian (35.6%, a difference of 0.35%), and Immigrants from Trinidad and Tobago (35.3%, a difference of 0.53%).
| Demographics | Rating | Rank | Bachelor's Degree |
| French Canadians | 8.3 /100 | #223 | Tragic 35.6% |
| Immigrants | Barbados | 7.5 /100 | #224 | Tragic 35.5% |
| Immigrants | Burma/Myanmar | 7.3 /100 | #225 | Tragic 35.5% |
| Portuguese | 7.2 /100 | #226 | Tragic 35.5% |
| Ecuadorians | 6.6 /100 | #227 | Tragic 35.4% |
| Immigrants | Trinidad and Tobago | 6.0 /100 | #228 | Tragic 35.3% |
| Whites/Caucasians | 5.9 /100 | #229 | Tragic 35.3% |
| Immigrants | Grenada | 4.3 /100 | #230 | Tragic 35.0% |
| Immigrants | St. Vincent and the Grenadines | 4.3 /100 | #231 | Tragic 35.0% |
| Hmong | 3.4 /100 | #232 | Tragic 34.8% |
| Immigrants | Ecuador | 3.3 /100 | #233 | Tragic 34.7% |
| Guamanians/Chamorros | 3.0 /100 | #234 | Tragic 34.6% |
| Immigrants | West Indies | 2.9 /100 | #235 | Tragic 34.6% |
| Liberians | 2.8 /100 | #236 | Tragic 34.6% |
| Tlingit-Haida | 2.8 /100 | #237 | Tragic 34.6% |
| Guyanese | 2.5 /100 | #238 | Tragic 34.5% |
| British West Indians | 2.5 /100 | #239 | Tragic 34.5% |
| Tongans | 2.0 /100 | #240 | Tragic 34.3% |
| Immigrants | Cambodia | 1.9 /100 | #241 | Tragic 34.2% |
| Immigrants | Nonimmigrants | 1.8 /100 | #242 | Tragic 34.2% |
| Immigrants | Guyana | 1.4 /100 | #243 | Tragic 33.9% |