Japanese vs Immigrants from Pakistan 2nd Grade
COMPARE
Japanese
Immigrants from Pakistan
2nd Grade
2nd Grade Comparison
Japanese
Immigrants from Pakistan
96.5%
2ND GRADE
0.0/ 100
METRIC RATING
329th/ 347
METRIC RANK
97.6%
2ND GRADE
2.3/ 100
METRIC RATING
231st/ 347
METRIC RANK
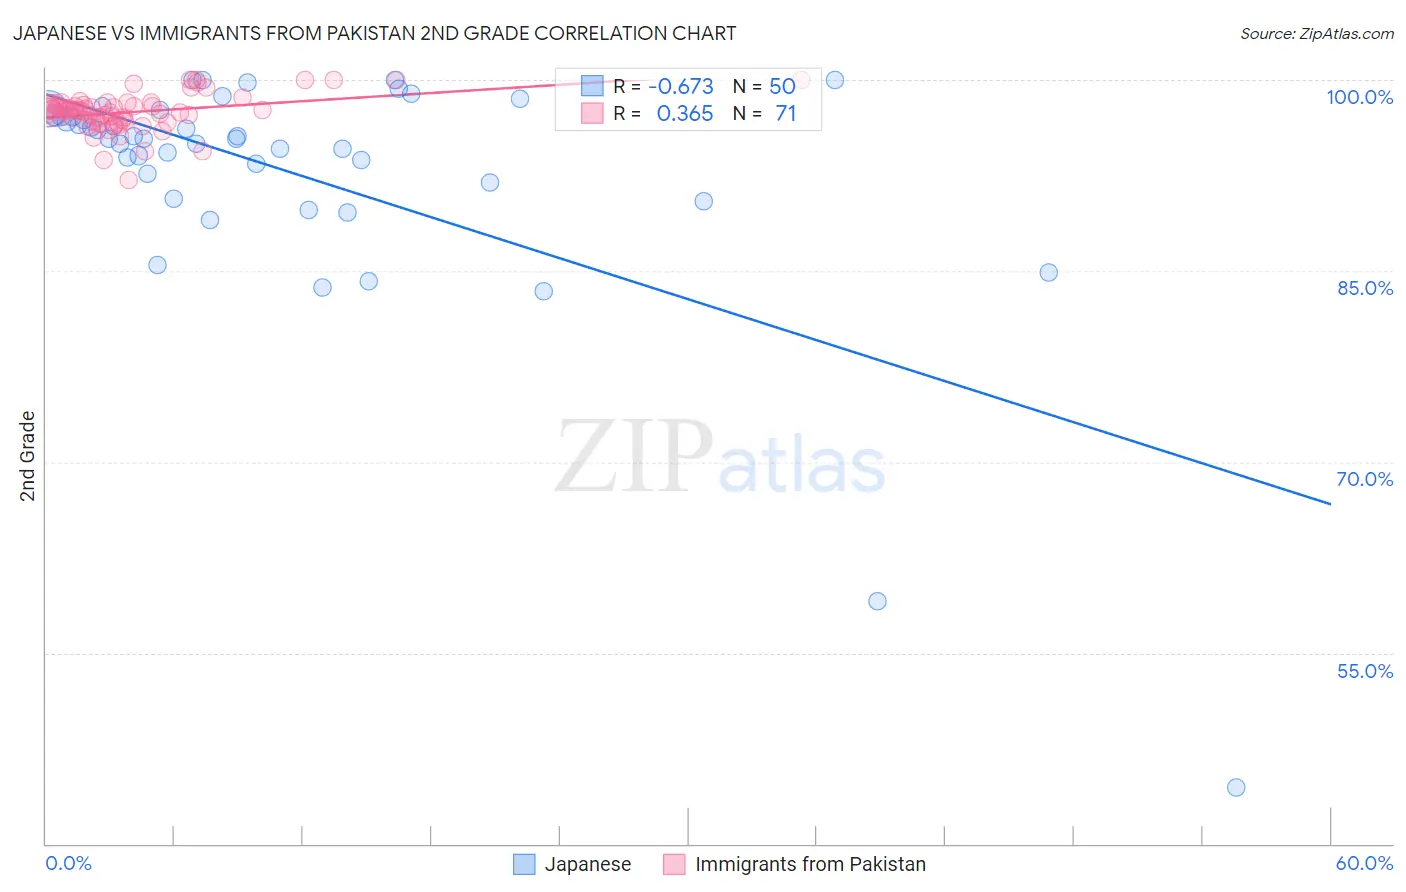
Japanese vs Immigrants from Pakistan 2nd Grade Correlation Chart
The statistical analysis conducted on geographies consisting of 249,183,224 people shows a significant negative correlation between the proportion of Japanese and percentage of population with at least 2nd grade education in the United States with a correlation coefficient (R) of -0.673 and weighted average of 96.5%. Similarly, the statistical analysis conducted on geographies consisting of 283,900,935 people shows a mild positive correlation between the proportion of Immigrants from Pakistan and percentage of population with at least 2nd grade education in the United States with a correlation coefficient (R) of 0.365 and weighted average of 97.6%, a difference of 1.1%.
2nd Grade Correlation Summary
| Measurement | Japanese | Immigrants from Pakistan |
| Minimum | 44.4% | 92.1% |
| Maximum | 100.0% | 100.0% |
| Range | 55.6% | 7.9% |
| Mean | 92.8% | 97.5% |
| Median | 95.4% | 97.6% |
| Interquartile 25% (IQ1) | 92.0% | 96.8% |
| Interquartile 75% (IQ3) | 97.2% | 98.0% |
| Interquartile Range (IQR) | 5.2% | 1.2% |
| Standard Deviation (Sample) | 9.7% | 1.4% |
| Standard Deviation (Population) | 9.6% | 1.4% |
Similar Demographics by 2nd Grade
Demographics Similar to Japanese by 2nd Grade
In terms of 2nd grade, the demographic groups most similar to Japanese are Mexican (96.5%, a difference of 0.0%), Immigrants from Vietnam (96.5%, a difference of 0.010%), Immigrants from Latin America (96.5%, a difference of 0.010%), Immigrants from Armenia (96.5%, a difference of 0.040%), and Bangladeshi (96.5%, a difference of 0.060%).
| Demographics | Rating | Rank | 2nd Grade |
| Immigrants | Bangladesh | 0.0 /100 | #322 | Tragic 96.7% |
| Vietnamese | 0.0 /100 | #323 | Tragic 96.7% |
| Mexican American Indians | 0.0 /100 | #324 | Tragic 96.7% |
| Dominicans | 0.0 /100 | #325 | Tragic 96.6% |
| Immigrants | Honduras | 0.0 /100 | #326 | Tragic 96.6% |
| Immigrants | Vietnam | 0.0 /100 | #327 | Tragic 96.5% |
| Mexicans | 0.0 /100 | #328 | Tragic 96.5% |
| Japanese | 0.0 /100 | #329 | Tragic 96.5% |
| Immigrants | Latin America | 0.0 /100 | #330 | Tragic 96.5% |
| Immigrants | Armenia | 0.0 /100 | #331 | Tragic 96.5% |
| Bangladeshis | 0.0 /100 | #332 | Tragic 96.5% |
| Immigrants | Dominican Republic | 0.0 /100 | #333 | Tragic 96.4% |
| Central Americans | 0.0 /100 | #334 | Tragic 96.4% |
| Yakama | 0.0 /100 | #335 | Tragic 96.4% |
| Immigrants | Fiji | 0.0 /100 | #336 | Tragic 96.4% |
Demographics Similar to Immigrants from Pakistan by 2nd Grade
In terms of 2nd grade, the demographic groups most similar to Immigrants from Pakistan are Immigrants from Western Asia (97.6%, a difference of 0.010%), Immigrants from Uruguay (97.6%, a difference of 0.010%), Immigrants from Malaysia (97.6%, a difference of 0.010%), Colombian (97.6%, a difference of 0.010%), and Immigrants from Costa Rica (97.6%, a difference of 0.020%).
| Demographics | Rating | Rank | 2nd Grade |
| Immigrants | Zaire | 4.3 /100 | #224 | Tragic 97.6% |
| Tongans | 4.3 /100 | #225 | Tragic 97.6% |
| Immigrants | Syria | 4.0 /100 | #226 | Tragic 97.6% |
| Immigrants | Nepal | 4.0 /100 | #227 | Tragic 97.6% |
| Sub-Saharan Africans | 3.4 /100 | #228 | Tragic 97.6% |
| Immigrants | Costa Rica | 3.1 /100 | #229 | Tragic 97.6% |
| Senegalese | 3.1 /100 | #230 | Tragic 97.6% |
| Immigrants | Pakistan | 2.3 /100 | #231 | Tragic 97.6% |
| Immigrants | Western Asia | 2.1 /100 | #232 | Tragic 97.6% |
| Immigrants | Uruguay | 2.1 /100 | #233 | Tragic 97.6% |
| Immigrants | Malaysia | 2.0 /100 | #234 | Tragic 97.6% |
| Colombians | 1.9 /100 | #235 | Tragic 97.6% |
| Nigerians | 1.7 /100 | #236 | Tragic 97.6% |
| U.S. Virgin Islanders | 1.6 /100 | #237 | Tragic 97.6% |
| Immigrants | Eastern Asia | 1.6 /100 | #238 | Tragic 97.6% |