Immigrants from Costa Rica vs Immigrants from Pakistan 2nd Grade
COMPARE
Immigrants from Costa Rica
Immigrants from Pakistan
2nd Grade
2nd Grade Comparison
Immigrants from Costa Rica
Immigrants from Pakistan
97.6%
2ND GRADE
3.1/ 100
METRIC RATING
229th/ 347
METRIC RANK
97.6%
2ND GRADE
2.3/ 100
METRIC RATING
231st/ 347
METRIC RANK
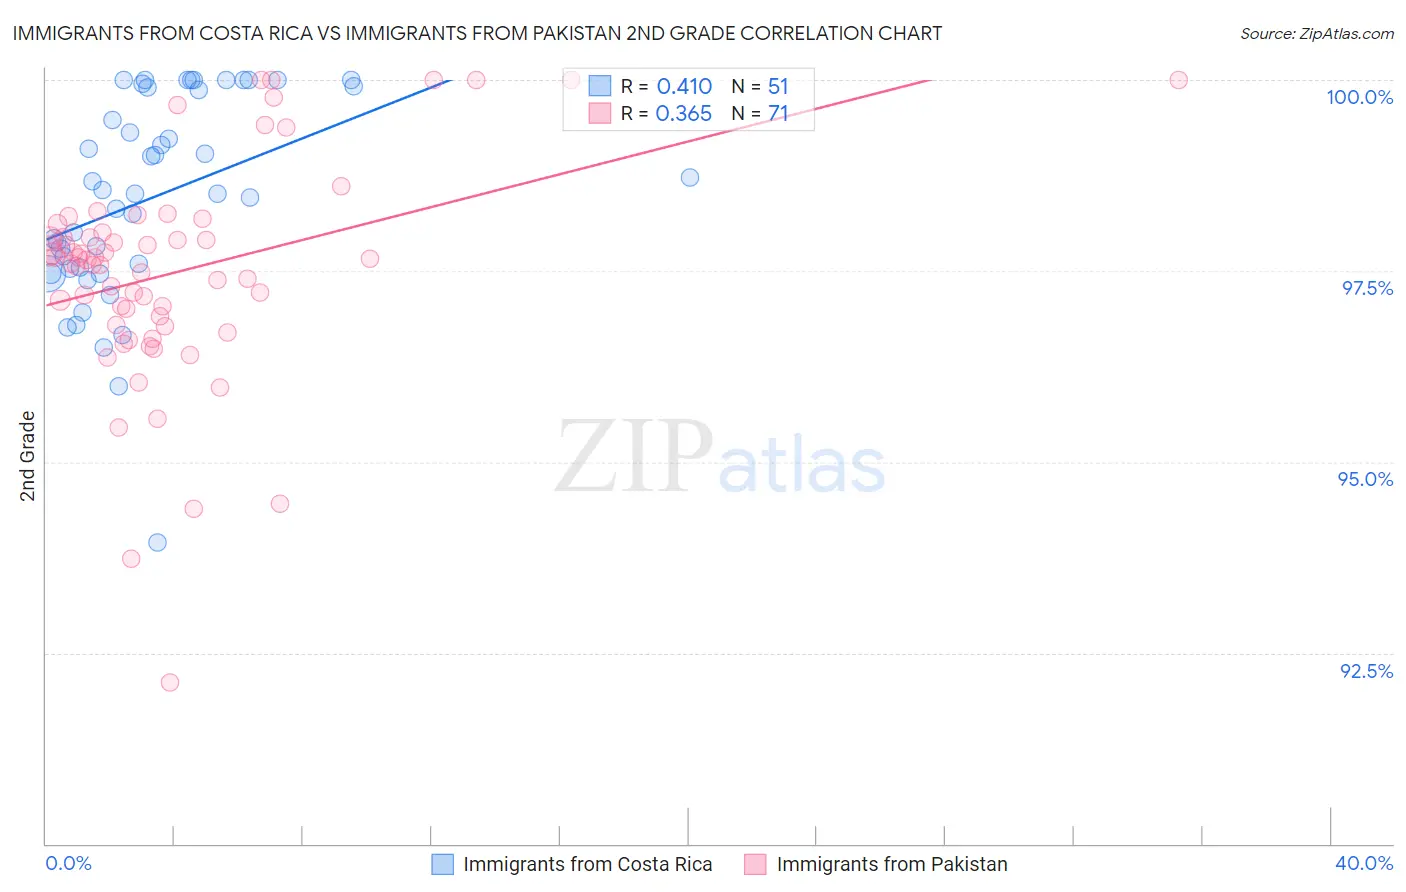
Immigrants from Costa Rica vs Immigrants from Pakistan 2nd Grade Correlation Chart
The statistical analysis conducted on geographies consisting of 204,275,869 people shows a moderate positive correlation between the proportion of Immigrants from Costa Rica and percentage of population with at least 2nd grade education in the United States with a correlation coefficient (R) of 0.410 and weighted average of 97.6%. Similarly, the statistical analysis conducted on geographies consisting of 283,900,935 people shows a mild positive correlation between the proportion of Immigrants from Pakistan and percentage of population with at least 2nd grade education in the United States with a correlation coefficient (R) of 0.365 and weighted average of 97.6%, a difference of 0.020%.
2nd Grade Correlation Summary
| Measurement | Immigrants from Costa Rica | Immigrants from Pakistan |
| Minimum | 93.9% | 92.1% |
| Maximum | 100.0% | 100.0% |
| Range | 6.1% | 7.9% |
| Mean | 98.5% | 97.5% |
| Median | 98.5% | 97.6% |
| Interquartile 25% (IQ1) | 97.5% | 96.8% |
| Interquartile 75% (IQ3) | 99.9% | 98.0% |
| Interquartile Range (IQR) | 2.4% | 1.2% |
| Standard Deviation (Sample) | 1.3% | 1.4% |
| Standard Deviation (Population) | 1.3% | 1.4% |
Demographics Similar to Immigrants from Costa Rica and Immigrants from Pakistan by 2nd Grade
In terms of 2nd grade, the demographic groups most similar to Immigrants from Costa Rica are Senegalese (97.6%, a difference of 0.0%), Subsaharan African (97.6%, a difference of 0.010%), Immigrants from Syria (97.6%, a difference of 0.020%), Immigrants from Nepal (97.6%, a difference of 0.020%), and Iraqi (97.6%, a difference of 0.030%). Similarly, the demographic groups most similar to Immigrants from Pakistan are Immigrants from Western Asia (97.6%, a difference of 0.010%), Immigrants from Uruguay (97.6%, a difference of 0.010%), Immigrants from Malaysia (97.6%, a difference of 0.010%), Colombian (97.6%, a difference of 0.010%), and Senegalese (97.6%, a difference of 0.020%).
| Demographics | Rating | Rank | 2nd Grade |
| Immigrants | Morocco | 5.0 /100 | #220 | Tragic 97.6% |
| Iraqis | 4.6 /100 | #221 | Tragic 97.6% |
| Immigrants | Sudan | 4.5 /100 | #222 | Tragic 97.6% |
| Sierra Leoneans | 4.3 /100 | #223 | Tragic 97.6% |
| Immigrants | Zaire | 4.3 /100 | #224 | Tragic 97.6% |
| Tongans | 4.3 /100 | #225 | Tragic 97.6% |
| Immigrants | Syria | 4.0 /100 | #226 | Tragic 97.6% |
| Immigrants | Nepal | 4.0 /100 | #227 | Tragic 97.6% |
| Sub-Saharan Africans | 3.4 /100 | #228 | Tragic 97.6% |
| Immigrants | Costa Rica | 3.1 /100 | #229 | Tragic 97.6% |
| Senegalese | 3.1 /100 | #230 | Tragic 97.6% |
| Immigrants | Pakistan | 2.3 /100 | #231 | Tragic 97.6% |
| Immigrants | Western Asia | 2.1 /100 | #232 | Tragic 97.6% |
| Immigrants | Uruguay | 2.1 /100 | #233 | Tragic 97.6% |
| Immigrants | Malaysia | 2.0 /100 | #234 | Tragic 97.6% |
| Colombians | 1.9 /100 | #235 | Tragic 97.6% |
| Nigerians | 1.7 /100 | #236 | Tragic 97.6% |
| U.S. Virgin Islanders | 1.6 /100 | #237 | Tragic 97.6% |
| Immigrants | Eastern Asia | 1.6 /100 | #238 | Tragic 97.6% |
| Liberians | 1.6 /100 | #239 | Tragic 97.6% |
| Koreans | 1.5 /100 | #240 | Tragic 97.5% |