Iroquois vs Kenyan 10th Grade
COMPARE
Iroquois
Kenyan
10th Grade
10th Grade Comparison
Iroquois
Kenyans
94.3%
10TH GRADE
92.8/ 100
METRIC RATING
129th/ 347
METRIC RANK
94.0%
10TH GRADE
79.1/ 100
METRIC RATING
151st/ 347
METRIC RANK
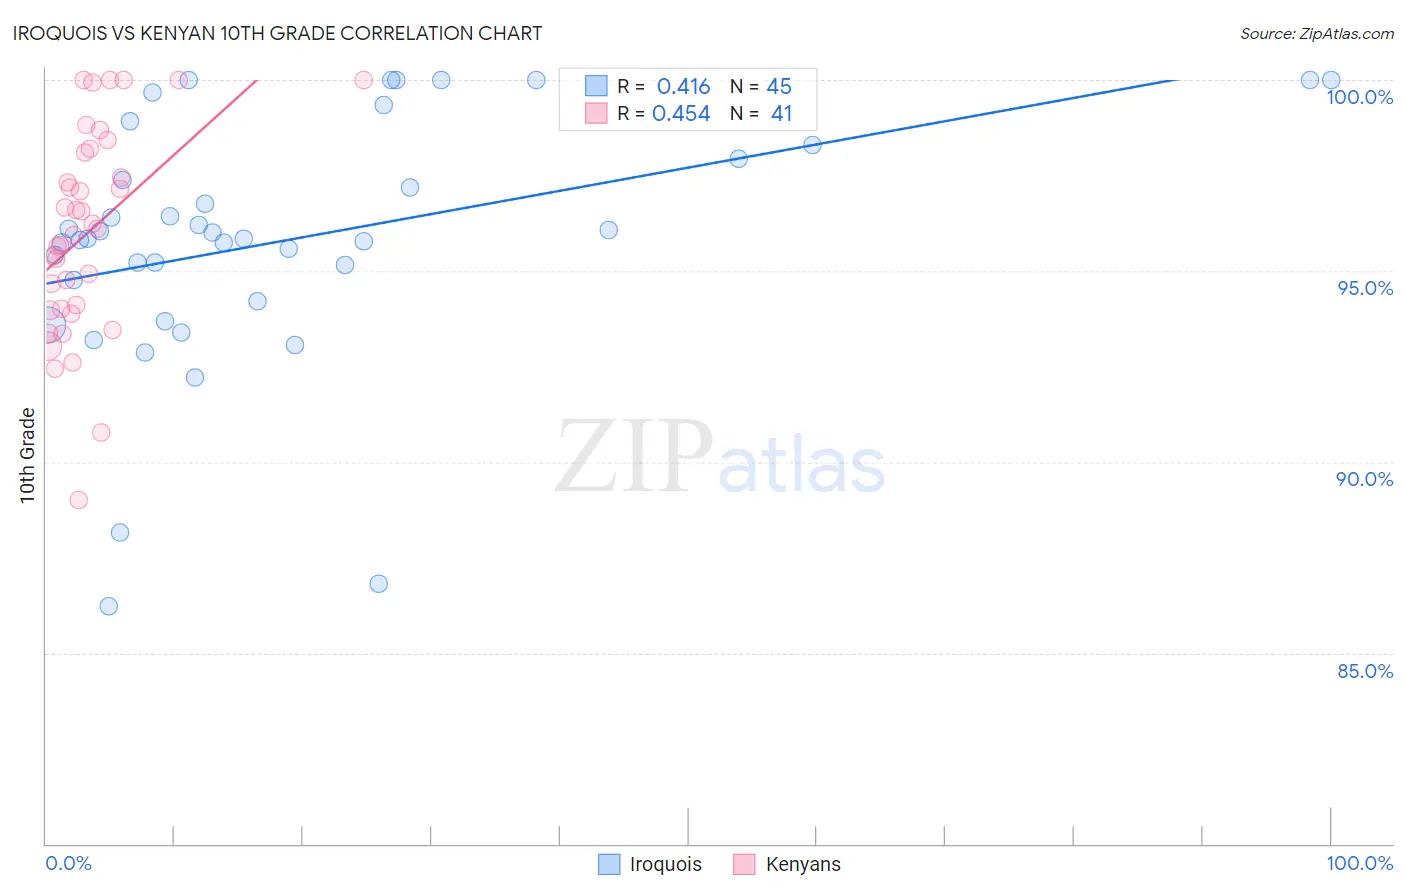
Iroquois vs Kenyan 10th Grade Correlation Chart
The statistical analysis conducted on geographies consisting of 207,308,712 people shows a moderate positive correlation between the proportion of Iroquois and percentage of population with at least 10th grade education in the United States with a correlation coefficient (R) of 0.416 and weighted average of 94.3%. Similarly, the statistical analysis conducted on geographies consisting of 168,244,042 people shows a moderate positive correlation between the proportion of Kenyans and percentage of population with at least 10th grade education in the United States with a correlation coefficient (R) of 0.454 and weighted average of 94.0%, a difference of 0.27%.
10th Grade Correlation Summary
| Measurement | Iroquois | Kenyan |
| Minimum | 86.2% | 89.0% |
| Maximum | 100.0% | 100.0% |
| Range | 13.8% | 11.0% |
| Mean | 95.8% | 96.0% |
| Median | 95.8% | 96.1% |
| Interquartile 25% (IQ1) | 94.5% | 94.0% |
| Interquartile 75% (IQ3) | 98.1% | 98.2% |
| Interquartile Range (IQR) | 3.6% | 4.2% |
| Standard Deviation (Sample) | 3.3% | 2.7% |
| Standard Deviation (Population) | 3.2% | 2.6% |
Similar Demographics by 10th Grade
Demographics Similar to Iroquois by 10th Grade
In terms of 10th grade, the demographic groups most similar to Iroquois are Immigrants from Greece (94.3%, a difference of 0.0%), Immigrants from Eastern Europe (94.3%, a difference of 0.010%), Immigrants from Russia (94.3%, a difference of 0.010%), Potawatomi (94.3%, a difference of 0.030%), and Creek (94.2%, a difference of 0.030%).
| Demographics | Rating | Rank | 10th Grade |
| Inupiat | 95.1 /100 | #122 | Exceptional 94.4% |
| Cree | 95.1 /100 | #123 | Exceptional 94.4% |
| Basques | 94.9 /100 | #124 | Exceptional 94.3% |
| Americans | 94.4 /100 | #125 | Exceptional 94.3% |
| Immigrants | Iran | 94.4 /100 | #126 | Exceptional 94.3% |
| Israelis | 93.8 /100 | #127 | Exceptional 94.3% |
| Potawatomi | 93.6 /100 | #128 | Exceptional 94.3% |
| Iroquois | 92.8 /100 | #129 | Exceptional 94.3% |
| Immigrants | Greece | 92.7 /100 | #130 | Exceptional 94.3% |
| Immigrants | Eastern Europe | 92.5 /100 | #131 | Exceptional 94.3% |
| Immigrants | Russia | 92.4 /100 | #132 | Exceptional 94.3% |
| Creek | 91.9 /100 | #133 | Exceptional 94.2% |
| Osage | 91.7 /100 | #134 | Exceptional 94.2% |
| Immigrants | Korea | 91.3 /100 | #135 | Exceptional 94.2% |
| Shoshone | 90.8 /100 | #136 | Exceptional 94.2% |
Demographics Similar to Kenyans by 10th Grade
In terms of 10th grade, the demographic groups most similar to Kenyans are Egyptian (94.0%, a difference of 0.010%), Immigrants from Italy (94.0%, a difference of 0.010%), Ugandan (94.0%, a difference of 0.020%), Immigrants from Ukraine (94.0%, a difference of 0.030%), and Arab (94.0%, a difference of 0.030%).
| Demographics | Rating | Rank | 10th Grade |
| Immigrants | Kazakhstan | 84.9 /100 | #144 | Excellent 94.1% |
| Immigrants | Nonimmigrants | 83.8 /100 | #145 | Excellent 94.1% |
| Chickasaw | 82.6 /100 | #146 | Excellent 94.1% |
| Immigrants | Ukraine | 81.5 /100 | #147 | Excellent 94.0% |
| Arabs | 80.9 /100 | #148 | Excellent 94.0% |
| Ugandans | 80.7 /100 | #149 | Excellent 94.0% |
| Egyptians | 79.6 /100 | #150 | Good 94.0% |
| Kenyans | 79.1 /100 | #151 | Good 94.0% |
| Immigrants | Italy | 78.0 /100 | #152 | Good 94.0% |
| Immigrants | Brazil | 75.5 /100 | #153 | Good 94.0% |
| Immigrants | Kenya | 75.3 /100 | #154 | Good 94.0% |
| Spanish | 74.9 /100 | #155 | Good 94.0% |
| Mongolians | 74.4 /100 | #156 | Good 94.0% |
| Kiowa | 73.3 /100 | #157 | Good 93.9% |
| Bermudans | 71.0 /100 | #158 | Good 93.9% |