Iroquois vs Immigrants from Europe 10th Grade
COMPARE
Iroquois
Immigrants from Europe
10th Grade
10th Grade Comparison
Iroquois
Immigrants from Europe
94.3%
10TH GRADE
92.8/ 100
METRIC RATING
129th/ 347
METRIC RANK
94.5%
10TH GRADE
97.5/ 100
METRIC RATING
103rd/ 347
METRIC RANK
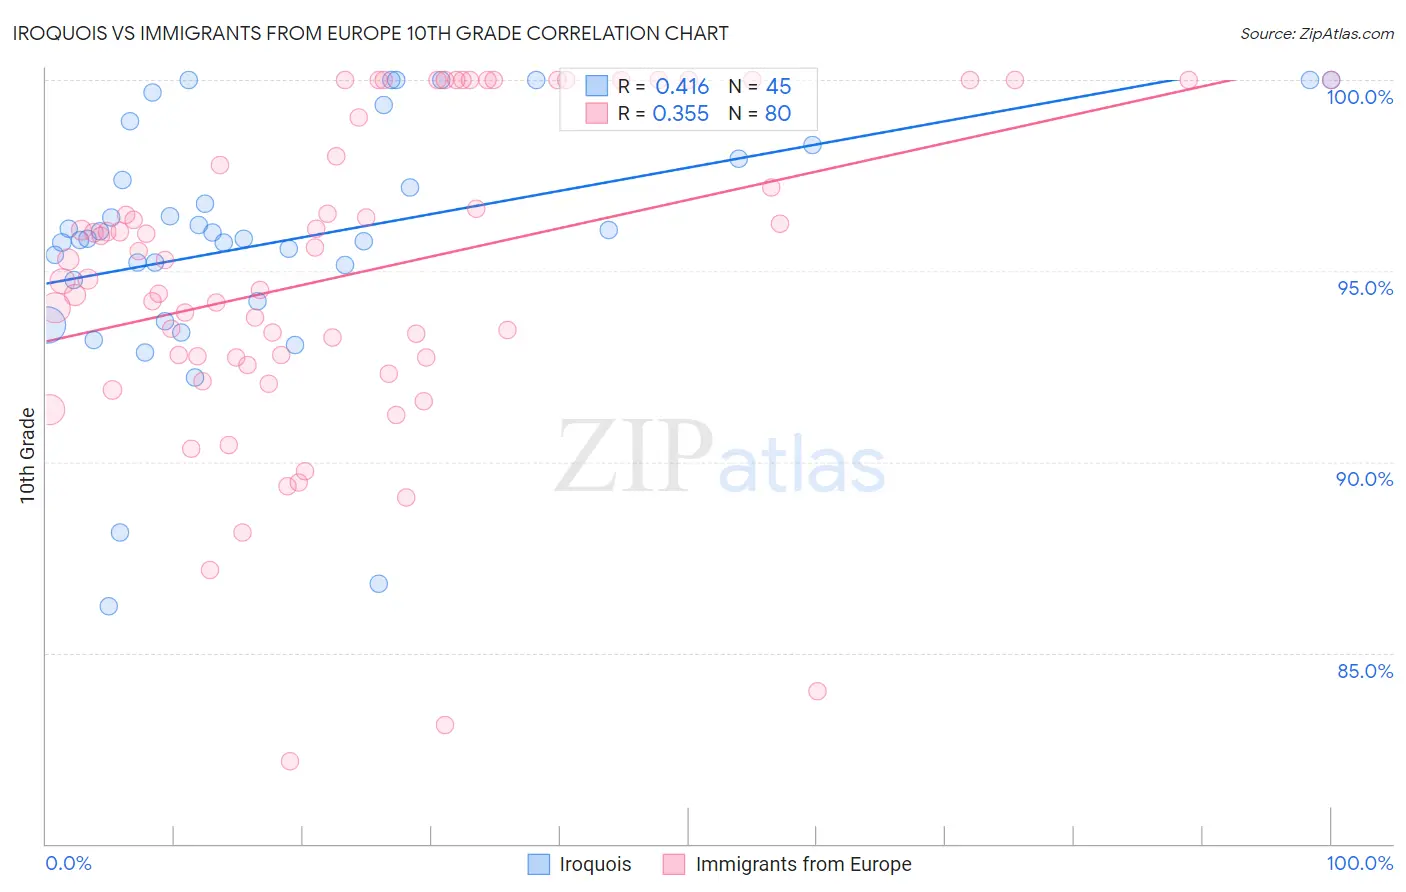
Iroquois vs Immigrants from Europe 10th Grade Correlation Chart
The statistical analysis conducted on geographies consisting of 207,308,712 people shows a moderate positive correlation between the proportion of Iroquois and percentage of population with at least 10th grade education in the United States with a correlation coefficient (R) of 0.416 and weighted average of 94.3%. Similarly, the statistical analysis conducted on geographies consisting of 547,425,973 people shows a mild positive correlation between the proportion of Immigrants from Europe and percentage of population with at least 10th grade education in the United States with a correlation coefficient (R) of 0.355 and weighted average of 94.5%, a difference of 0.24%.
10th Grade Correlation Summary
| Measurement | Iroquois | Immigrants from Europe |
| Minimum | 86.2% | 82.2% |
| Maximum | 100.0% | 100.0% |
| Range | 13.8% | 17.8% |
| Mean | 95.8% | 95.0% |
| Median | 95.8% | 95.3% |
| Interquartile 25% (IQ1) | 94.5% | 92.7% |
| Interquartile 75% (IQ3) | 98.1% | 99.5% |
| Interquartile Range (IQR) | 3.6% | 6.8% |
| Standard Deviation (Sample) | 3.3% | 4.2% |
| Standard Deviation (Population) | 3.2% | 4.2% |
Similar Demographics by 10th Grade
Demographics Similar to Iroquois by 10th Grade
In terms of 10th grade, the demographic groups most similar to Iroquois are Immigrants from Greece (94.3%, a difference of 0.0%), Immigrants from Eastern Europe (94.3%, a difference of 0.010%), Immigrants from Russia (94.3%, a difference of 0.010%), Potawatomi (94.3%, a difference of 0.030%), and Creek (94.2%, a difference of 0.030%).
| Demographics | Rating | Rank | 10th Grade |
| Inupiat | 95.1 /100 | #122 | Exceptional 94.4% |
| Cree | 95.1 /100 | #123 | Exceptional 94.4% |
| Basques | 94.9 /100 | #124 | Exceptional 94.3% |
| Americans | 94.4 /100 | #125 | Exceptional 94.3% |
| Immigrants | Iran | 94.4 /100 | #126 | Exceptional 94.3% |
| Israelis | 93.8 /100 | #127 | Exceptional 94.3% |
| Potawatomi | 93.6 /100 | #128 | Exceptional 94.3% |
| Iroquois | 92.8 /100 | #129 | Exceptional 94.3% |
| Immigrants | Greece | 92.7 /100 | #130 | Exceptional 94.3% |
| Immigrants | Eastern Europe | 92.5 /100 | #131 | Exceptional 94.3% |
| Immigrants | Russia | 92.4 /100 | #132 | Exceptional 94.3% |
| Creek | 91.9 /100 | #133 | Exceptional 94.2% |
| Osage | 91.7 /100 | #134 | Exceptional 94.2% |
| Immigrants | Korea | 91.3 /100 | #135 | Exceptional 94.2% |
| Shoshone | 90.8 /100 | #136 | Exceptional 94.2% |
Demographics Similar to Immigrants from Europe by 10th Grade
In terms of 10th grade, the demographic groups most similar to Immigrants from Europe are Immigrants from Romania (94.5%, a difference of 0.0%), Immigrants from Turkey (94.5%, a difference of 0.010%), Immigrants from Serbia (94.5%, a difference of 0.010%), Immigrants from Croatia (94.5%, a difference of 0.010%), and Syrian (94.5%, a difference of 0.020%).
| Demographics | Rating | Rank | 10th Grade |
| Immigrants | Switzerland | 98.3 /100 | #96 | Exceptional 94.6% |
| Lebanese | 98.3 /100 | #97 | Exceptional 94.6% |
| Immigrants | Bulgaria | 98.1 /100 | #98 | Exceptional 94.6% |
| Immigrants | France | 97.9 /100 | #99 | Exceptional 94.5% |
| Immigrants | South Central Asia | 97.8 /100 | #100 | Exceptional 94.5% |
| Syrians | 97.7 /100 | #101 | Exceptional 94.5% |
| Cambodians | 97.6 /100 | #102 | Exceptional 94.5% |
| Immigrants | Europe | 97.5 /100 | #103 | Exceptional 94.5% |
| Immigrants | Romania | 97.5 /100 | #104 | Exceptional 94.5% |
| Immigrants | Turkey | 97.4 /100 | #105 | Exceptional 94.5% |
| Immigrants | Serbia | 97.4 /100 | #106 | Exceptional 94.5% |
| Immigrants | Croatia | 97.4 /100 | #107 | Exceptional 94.5% |
| Immigrants | North Macedonia | 97.2 /100 | #108 | Exceptional 94.5% |
| Immigrants | Norway | 97.2 /100 | #109 | Exceptional 94.5% |
| Burmese | 97.1 /100 | #110 | Exceptional 94.5% |