Iroquois vs Immigrants from Liberia 9th Grade

COMPARE

Iroquois
Race
Ancestry
AfghanAfricanAlaska NativeAlaskan AthabascanAlbanianAleutAlsatianAmericanApacheArabArapahoArgentineanArmenianAssyrian/Chaldean/SyriacAustralianAustrianBahamianBangladeshiBarbadianBasqueBelgianBelizeanBermudanBhutaneseBlackfeetBolivianBrazilianBritishBritish West IndianBulgarianBurmeseCajunCambodianCanadianCape VerdeanCarpatho RusynCelticCentral AmericanCentral American IndianCherokeeCheyenneChickasawChileanChineseChippewaChoctawColombianColvilleComancheCosta RicanCreeCreekCroatianCrowCubanCypriotCzechCzechoslovakianDanishDelawareDominicanDutchDutch West IndianEastern EuropeanEcuadorianEgyptianEnglishEstonianEthiopianEuropeanFijianFilipinoFinnishFrenchFrench American IndianFrench CanadianGermanGerman RussianGhanaianGreekGuamanian/ChamorroGuatemalanGuyaneseHaitianHmongHonduranHopiHoumaHungarianIcelanderIndian (Asian)IndonesianInupiatIranianIraqiIrishIroquoisIsraeliItalianJamaicanJapaneseJordanianKenyanKiowaKoreanLaotianLatvianLebaneseLiberianLithuanianLumbeeLuxembourgerMacedonianMalaysianMalteseMarshalleseMenomineeMexicanMexican American IndianMongolianMoroccanNative HawaiianNavajoNepaleseNew ZealanderNicaraguanNigerianNorthern EuropeanNorwegianOkinawanOsageOttawaPaiutePakistaniPalestinianPanamanianParaguayanPennsylvania GermanPeruvianPimaPolishPortuguesePotawatomiPuebloPuerto RicanPuget Sound SalishRomanianRussianSalvadoranSamoanScandinavianScotch-IrishScottishSeminoleSenegaleseSerbianShoshoneSierra LeoneanSiouxSlavicSlovakSloveneSomaliSouth AfricanSouth AmericanSouth American IndianSoviet UnionSpaniardSpanishSpanish AmericanSpanish American IndianSri LankanSubsaharan AfricanSudaneseSwedishSwissSyrianTaiwaneseThaiTlingit-HaidaTohono O'OdhamTonganTrinidadian and TobagonianTsimshianTurkishU.S. Virgin IslanderUgandanUkrainianUruguayanUteVenezuelanVietnameseWelshWest IndianYakamaYaquiYugoslavianYumanYup'ikZimbabwean
Immigration
NonimmigrantsImmigrantsAfghanistanAfricaAlbaniaArgentinaArmeniaAsiaAustraliaAustriaBahamasBangladeshBarbadosBelarusBelgiumBelizeBoliviaBosnia and HerzegovinaBrazilBulgariaBurma/MyanmarCabo VerdeCambodiaCameroonCanadaCaribbeanCentral AmericaChileChinaColombiaCongoCosta RicaCroatiaCubaCzechoslovakiaDenmarkDominicaDominican RepublicEastern AfricaEastern AsiaEastern EuropeEcuadorEgyptEl SalvadorEnglandEritreaEthiopiaEuropeFijiFranceGermanyGhanaGreeceGrenadaGuatemalaGuyanaHaitiHondurasHong KongHungaryIndiaIndonesiaIranIraqIrelandIsraelItalyJamaicaJapanJordanKazakhstanKenyaKoreaKuwaitLaosLatin AmericaLatviaLebanonLithuaniaMalaysiaMexicoMicronesiaMiddle AfricaMoldovaMoroccoNepalNetherlandsNicaraguaNigeriaNorth AmericaNorth MacedoniaNorthern AfricaNorthern EuropeNorwayOceaniaPakistanPanamaPeruPhilippinesPolandPortugalRomaniaRussiaSaudi ArabiaScotlandSenegalSerbiaSierra LeoneSingaporeSomaliaSouth AfricaSouth AmericaSouth Central AsiaSouth Eastern AsiaSouthern EuropeSpainSri LankaSt. Vincent and the GrenadinesSudanSwedenSwitzerlandSyriaTaiwanThailandTrinidad and TobagoTurkeyUgandaUkraineUruguayUzbekistanVenezuelaVietnamWest IndiesWestern AfricaWestern AsiaWestern EuropeYemenZaireZimbabweAzores
Immigrants from Liberia
Race
Ancestry
AfghanAfricanAlaska NativeAlaskan AthabascanAlbanianAleutAlsatianAmericanApacheArabArapahoArgentineanArmenianAssyrian/Chaldean/SyriacAustralianAustrianBahamianBangladeshiBarbadianBasqueBelgianBelizeanBermudanBhutaneseBlackfeetBolivianBrazilianBritishBritish West IndianBulgarianBurmeseCajunCambodianCanadianCape VerdeanCarpatho RusynCelticCentral AmericanCentral American IndianCherokeeCheyenneChickasawChileanChineseChippewaChoctawColombianColvilleComancheCosta RicanCreeCreekCroatianCrowCubanCypriotCzechCzechoslovakianDanishDelawareDominicanDutchDutch West IndianEastern EuropeanEcuadorianEgyptianEnglishEstonianEthiopianEuropeanFijianFilipinoFinnishFrenchFrench American IndianFrench CanadianGermanGerman RussianGhanaianGreekGuamanian/ChamorroGuatemalanGuyaneseHaitianHmongHonduranHopiHoumaHungarianIcelanderIndian (Asian)IndonesianInupiatIranianIraqiIrishIsraeliItalianJamaicanJapaneseJordanianKenyanKiowaKoreanLaotianLatvianLebaneseLiberianLithuanianLumbeeLuxembourgerMacedonianMalaysianMalteseMarshalleseMenomineeMexicanMexican American IndianMongolianMoroccanNative HawaiianNavajoNepaleseNew ZealanderNicaraguanNigerianNorthern EuropeanNorwegianOkinawanOsageOttawaPaiutePakistaniPalestinianPanamanianParaguayanPennsylvania GermanPeruvianPimaPolishPortuguesePotawatomiPuebloPuerto RicanPuget Sound SalishRomanianRussianSalvadoranSamoanScandinavianScotch-IrishScottishSeminoleSenegaleseSerbianShoshoneSierra LeoneanSiouxSlavicSlovakSloveneSomaliSouth AfricanSouth AmericanSouth American IndianSoviet UnionSpaniardSpanishSpanish AmericanSpanish American IndianSri LankanSubsaharan AfricanSudaneseSwedishSwissSyrianTaiwaneseThaiTlingit-HaidaTohono O'OdhamTonganTrinidadian and TobagonianTsimshianTurkishU.S. Virgin IslanderUgandanUkrainianUruguayanUteVenezuelanVietnameseWelshWest IndianYakamaYaquiYugoslavianYumanYup'ikZimbabwean
Immigration
NonimmigrantsImmigrantsAfghanistanAfricaAlbaniaArgentinaArmeniaAsiaAustraliaAustriaBahamasBangladeshBarbadosBelarusBelgiumBelizeBoliviaBosnia and HerzegovinaBrazilBulgariaBurma/MyanmarCabo VerdeCambodiaCameroonCanadaCaribbeanCentral AmericaChileChinaColombiaCongoCosta RicaCroatiaCubaCzechoslovakiaDenmarkDominicaDominican RepublicEastern AfricaEastern AsiaEastern EuropeEcuadorEgyptEl SalvadorEnglandEritreaEthiopiaEuropeFijiFranceGermanyGhanaGreeceGrenadaGuatemalaGuyanaHaitiHondurasHong KongHungaryIndiaIndonesiaIranIraqIrelandIsraelItalyJamaicaJapanJordanKazakhstanKenyaKoreaKuwaitLaosLatin AmericaLatviaLebanonLiberiaLithuaniaMalaysiaMexicoMicronesiaMiddle AfricaMoldovaMoroccoNepalNetherlandsNicaraguaNigeriaNorth AmericaNorth MacedoniaNorthern AfricaNorthern EuropeNorwayOceaniaPakistanPanamaPeruPhilippinesPolandPortugalRomaniaRussiaSaudi ArabiaScotlandSenegalSerbiaSierra LeoneSingaporeSomaliaSouth AfricaSouth AmericaSouth Central AsiaSouth Eastern AsiaSouthern EuropeSpainSri LankaSt. Vincent and the GrenadinesSudanSwedenSwitzerlandSyriaTaiwanThailandTrinidad and TobagoTurkeyUgandaUkraineUruguayUzbekistanVenezuelaVietnamWest IndiesWestern AfricaWestern AsiaWestern EuropeYemenZaireZimbabweAzores
9th Grade
Income
Poverty
Unemployment
Labor Participation
Family Structure
Vehicle Availability
Education Level
Disability

9th Grade Comparison

Iroquois

Immigrants from Liberia

Exceptional
Poor
95.4%
9TH GRADE
96.2/ 100
METRIC RATING
113th/ 347
METRIC RANK
94.5%
9TH GRADE
11.8/ 100
METRIC RATING
214th/ 347
METRIC RANK

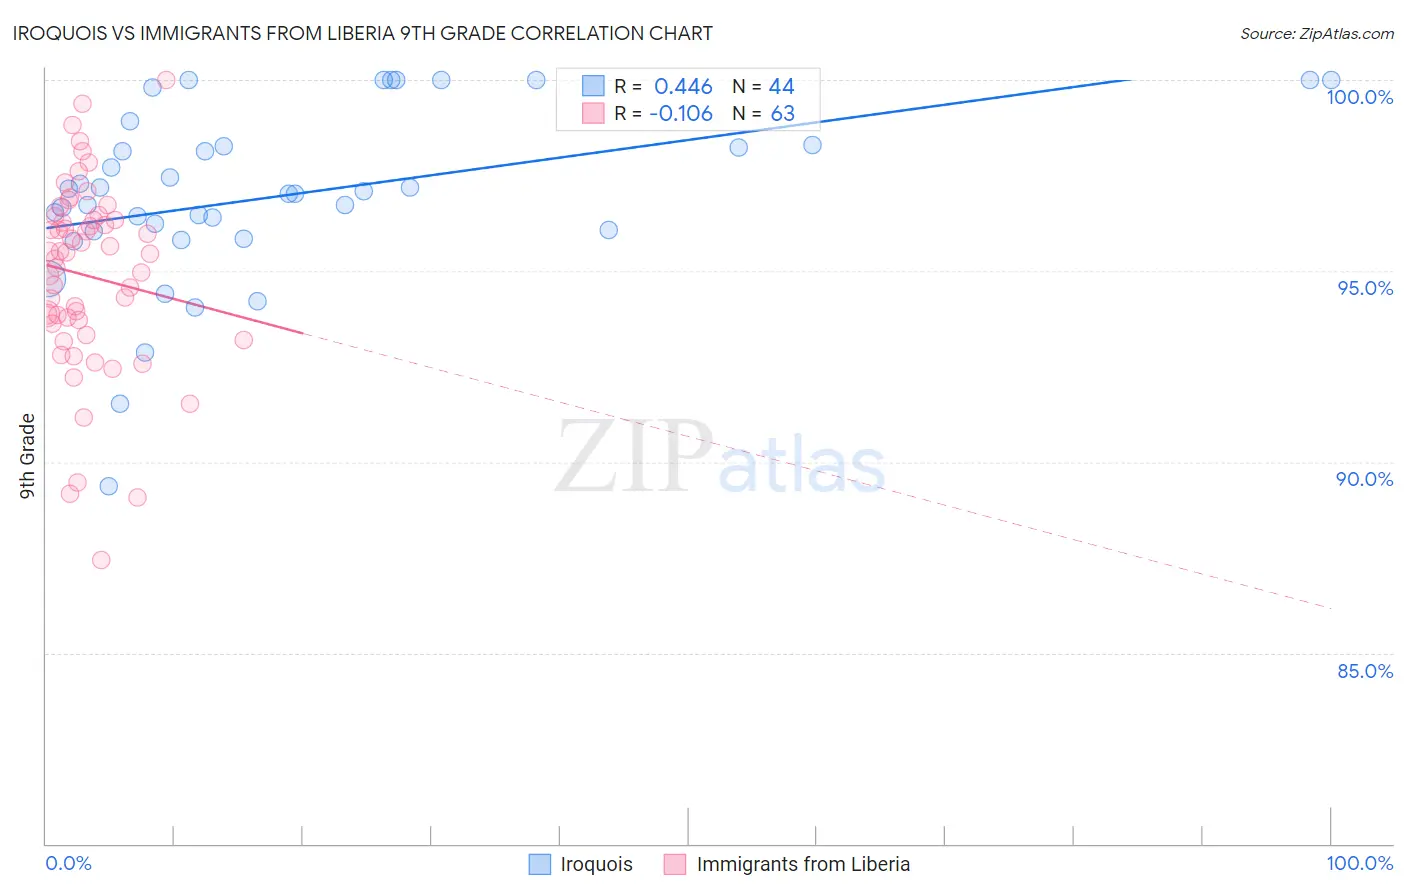
Iroquois vs Immigrants from Liberia 9th Grade Correlation Chart

The statistical analysis conducted on geographies consisting of 207,308,056 people shows a moderate positive correlation between the proportion of Iroquois and percentage of population with at least 9th grade education in the United States with a correlation coefficient (R) of 0.446 and weighted average of 95.4%. Similarly, the statistical analysis conducted on geographies consisting of 135,292,614 people shows a poor negative correlation between the proportion of Immigrants from Liberia and percentage of population with at least 9th grade education in the United States with a correlation coefficient (R) of -0.106 and weighted average of 94.5%, a difference of 0.96%.
Iroquois vs Immigrants from Liberia 9th Grade

9th Grade Correlation Summary

MeasurementIroquoisImmigrants from Liberia
Minimum89.4%87.4%
Maximum100.0%100.0%
Range10.6%12.6%
Mean97.0%94.9%
Median97.0%95.5%
Interquartile 25% (IQ1)96.1%93.6%
Interquartile 75% (IQ3)98.3%96.3%
Interquartile Range (IQR)2.2%2.7%
Standard Deviation (Sample)2.3%2.5%
Standard Deviation (Population)2.3%2.5%

Similar Demographics by 9th Grade

Demographics Similar to Iroquois by 9th Grade

In terms of 9th grade, the demographic groups most similar to Iroquois are Immigrants from Croatia (95.4%, a difference of 0.0%), German Russian (95.4%, a difference of 0.0%), Cherokee (95.4%, a difference of 0.010%), Burmese (95.4%, a difference of 0.010%), and Immigrants from Europe (95.4%, a difference of 0.020%).
DemographicsRating | Rank9th Grade
Immigrants | Norway
97.1
/100
|
#106
Exceptional
95.5%
Immigrants | Zimbabwe
96.9
/100
|
#107
Exceptional
95.5%
Chickasaw
96.8
/100
|
#108
Exceptional
95.5%
Osage
96.8
/100
|
#109
Exceptional
95.5%
Immigrants | Bulgaria
96.7
/100
|
#110
Exceptional
95.5%
Cherokee
96.3
/100
|
#111
Exceptional
95.4%
Immigrants | Croatia
96.2
/100
|
#112
Exceptional
95.4%
Iroquois
96.2
/100
|
#113
Exceptional
95.4%
German Russians
96.1
/100
|
#114
Exceptional
95.4%
Burmese
96.0
/100
|
#115
Exceptional
95.4%
Immigrants | Europe
95.7
/100
|
#116
Exceptional
95.4%
Immigrants | Romania
95.6
/100
|
#117
Exceptional
95.4%
Immigrants | Turkey
95.6
/100
|
#118
Exceptional
95.4%
Soviet Union
95.6
/100
|
#119
Exceptional
95.4%
Cambodians
95.6
/100
|
#120
Exceptional
95.4%

Demographics Similar to Immigrants from Liberia by 9th Grade

In terms of 9th grade, the demographic groups most similar to Immigrants from Liberia are Immigrants from Oceania (94.5%, a difference of 0.0%), Immigrants from Indonesia (94.5%, a difference of 0.010%), Immigrants from Malaysia (94.5%, a difference of 0.010%), Immigrants from Syria (94.5%, a difference of 0.010%), and Immigrants from Western Asia (94.5%, a difference of 0.020%).
DemographicsRating | Rank9th Grade
Immigrants | Morocco
16.3
/100
|
#207
Poor
94.6%
Immigrants | Pakistan
15.5
/100
|
#208
Poor
94.6%
Comanche
14.9
/100
|
#209
Poor
94.6%
Immigrants | Chile
13.4
/100
|
#210
Poor
94.5%
Immigrants | Indonesia
12.3
/100
|
#211
Poor
94.5%
Immigrants | Malaysia
12.2
/100
|
#212
Poor
94.5%
Immigrants | Oceania
12.1
/100
|
#213
Poor
94.5%
Immigrants | Liberia
11.8
/100
|
#214
Poor
94.5%
Immigrants | Syria
11.0
/100
|
#215
Poor
94.5%
Immigrants | Western Asia
10.7
/100
|
#216
Poor
94.5%
Asians
9.9
/100
|
#217
Tragic
94.5%
Portuguese
9.2
/100
|
#218
Tragic
94.5%
Africans
9.0
/100
|
#219
Tragic
94.5%
Indians (Asian)
8.6
/100
|
#220
Tragic
94.5%
Immigrants | Eastern Africa
8.2
/100
|
#221
Tragic
94.5%