Immigrants from Lebanon vs Immigrants from Liberia 9th Grade
COMPARE
Immigrants from Lebanon
Immigrants from Liberia
9th Grade
9th Grade Comparison
Immigrants from Lebanon
Immigrants from Liberia
94.7%
9TH GRADE
27.2/ 100
METRIC RATING
196th/ 347
METRIC RANK
94.5%
9TH GRADE
11.8/ 100
METRIC RATING
214th/ 347
METRIC RANK
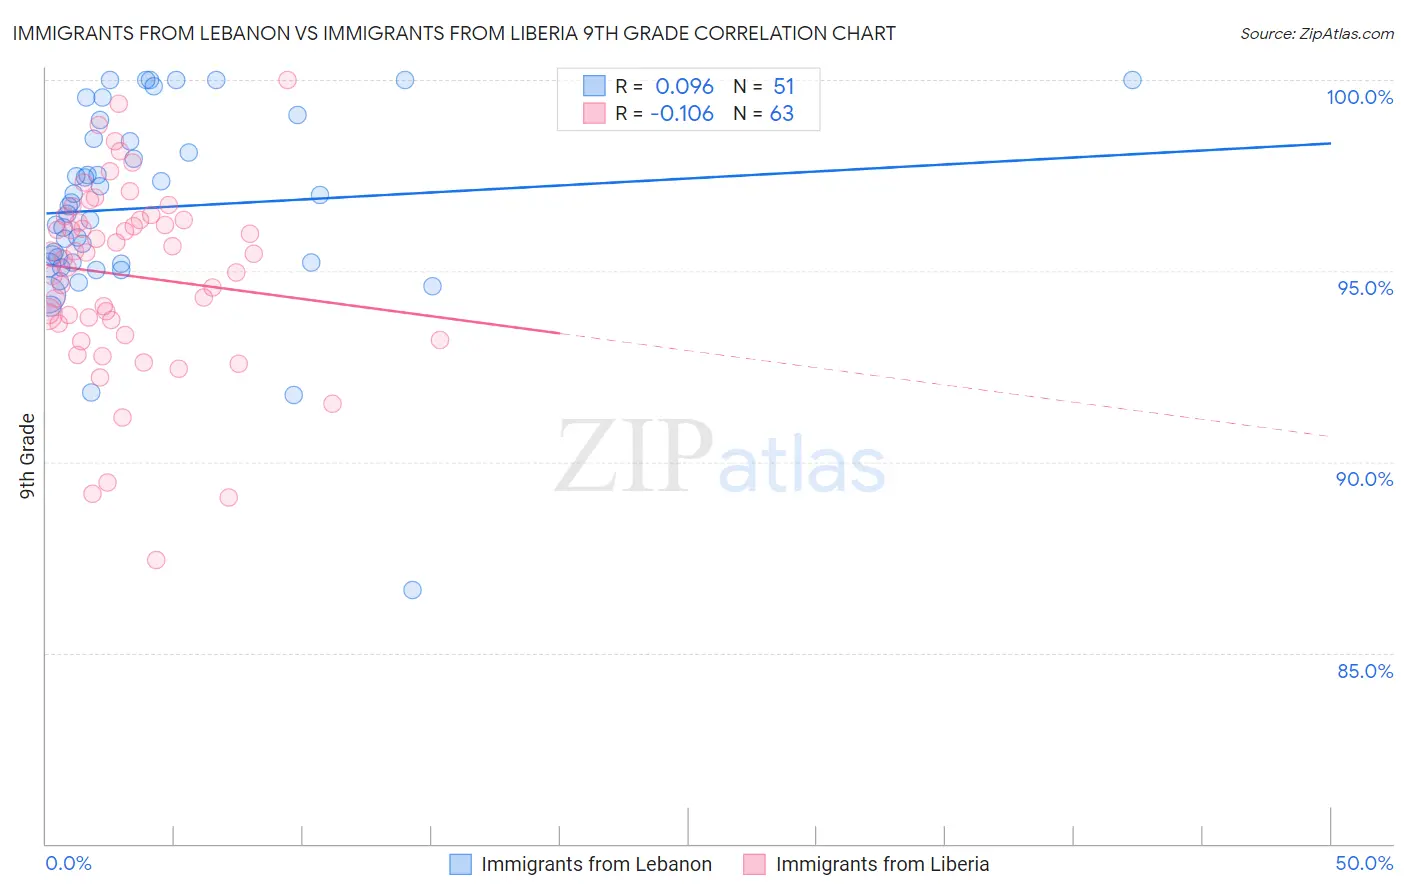
Immigrants from Lebanon vs Immigrants from Liberia 9th Grade Correlation Chart
The statistical analysis conducted on geographies consisting of 217,083,357 people shows a slight positive correlation between the proportion of Immigrants from Lebanon and percentage of population with at least 9th grade education in the United States with a correlation coefficient (R) of 0.096 and weighted average of 94.7%. Similarly, the statistical analysis conducted on geographies consisting of 135,292,614 people shows a poor negative correlation between the proportion of Immigrants from Liberia and percentage of population with at least 9th grade education in the United States with a correlation coefficient (R) of -0.106 and weighted average of 94.5%, a difference of 0.19%.
9th Grade Correlation Summary
| Measurement | Immigrants from Lebanon | Immigrants from Liberia |
| Minimum | 86.6% | 87.4% |
| Maximum | 100.0% | 100.0% |
| Range | 13.4% | 12.6% |
| Mean | 96.7% | 94.9% |
| Median | 96.7% | 95.5% |
| Interquartile 25% (IQ1) | 95.2% | 93.6% |
| Interquartile 75% (IQ3) | 98.4% | 96.3% |
| Interquartile Range (IQR) | 3.3% | 2.7% |
| Standard Deviation (Sample) | 2.6% | 2.5% |
| Standard Deviation (Population) | 2.5% | 2.5% |
Demographics Similar to Immigrants from Lebanon and Immigrants from Liberia by 9th Grade
In terms of 9th grade, the demographic groups most similar to Immigrants from Lebanon are Marshallese (94.7%, a difference of 0.010%), Immigrants from Micronesia (94.7%, a difference of 0.020%), Hawaiian (94.7%, a difference of 0.040%), Laotian (94.6%, a difference of 0.060%), and Immigrants from Zaire (94.6%, a difference of 0.070%). Similarly, the demographic groups most similar to Immigrants from Liberia are Immigrants from Oceania (94.5%, a difference of 0.0%), Immigrants from Indonesia (94.5%, a difference of 0.010%), Immigrants from Malaysia (94.5%, a difference of 0.010%), Immigrants from Syria (94.5%, a difference of 0.010%), and Immigrants from Chile (94.5%, a difference of 0.030%).
| Demographics | Rating | Rank | 9th Grade |
| Marshallese | 27.9 /100 | #195 | Fair 94.7% |
| Immigrants | Lebanon | 27.2 /100 | #196 | Fair 94.7% |
| Immigrants | Micronesia | 24.7 /100 | #197 | Fair 94.7% |
| Hawaiians | 22.7 /100 | #198 | Fair 94.7% |
| Laotians | 21.0 /100 | #199 | Fair 94.6% |
| Immigrants | Zaire | 20.6 /100 | #200 | Fair 94.6% |
| Blacks/African Americans | 20.5 /100 | #201 | Fair 94.6% |
| Immigrants | Eastern Asia | 19.8 /100 | #202 | Poor 94.6% |
| Immigrants | Bahamas | 19.8 /100 | #203 | Poor 94.6% |
| Moroccans | 19.6 /100 | #204 | Poor 94.6% |
| Immigrants | Sudan | 17.6 /100 | #205 | Poor 94.6% |
| Samoans | 17.3 /100 | #206 | Poor 94.6% |
| Immigrants | Morocco | 16.3 /100 | #207 | Poor 94.6% |
| Immigrants | Pakistan | 15.5 /100 | #208 | Poor 94.6% |
| Comanche | 14.9 /100 | #209 | Poor 94.6% |
| Immigrants | Chile | 13.4 /100 | #210 | Poor 94.5% |
| Immigrants | Indonesia | 12.3 /100 | #211 | Poor 94.5% |
| Immigrants | Malaysia | 12.2 /100 | #212 | Poor 94.5% |
| Immigrants | Oceania | 12.1 /100 | #213 | Poor 94.5% |
| Immigrants | Liberia | 11.8 /100 | #214 | Poor 94.5% |
| Immigrants | Syria | 11.0 /100 | #215 | Poor 94.5% |