Irish vs Immigrants from Trinidad and Tobago Doctorate Degree
COMPARE
Irish
Immigrants from Trinidad and Tobago
Doctorate Degree
Doctorate Degree Comparison
Irish
Immigrants from Trinidad and Tobago
1.9%
DOCTORATE DEGREE
67.5/ 100
METRIC RATING
162nd/ 347
METRIC RANK
1.5%
DOCTORATE DEGREE
0.5/ 100
METRIC RATING
271st/ 347
METRIC RANK
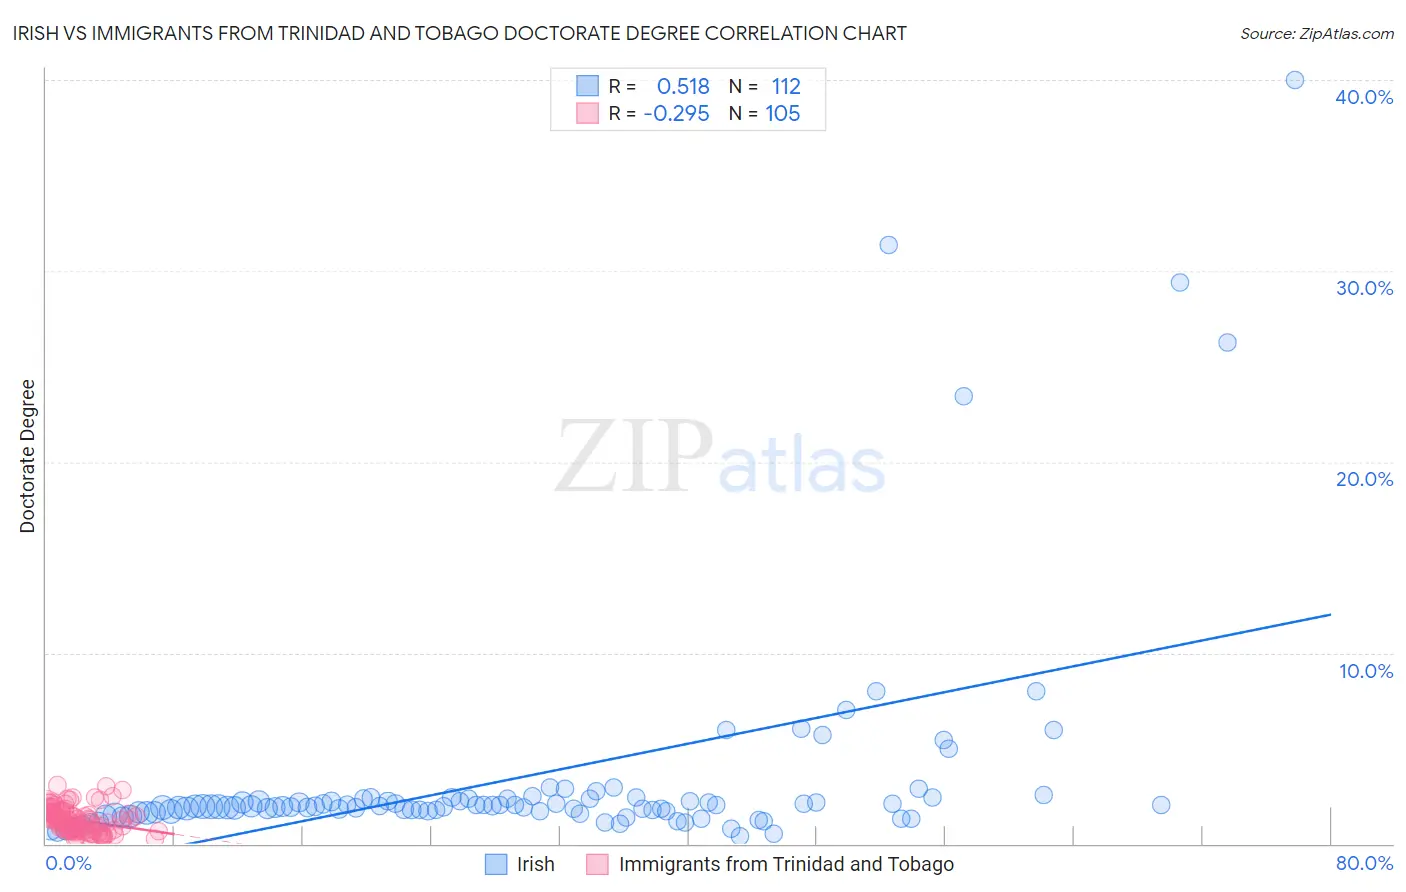
Irish vs Immigrants from Trinidad and Tobago Doctorate Degree Correlation Chart
The statistical analysis conducted on geographies consisting of 550,861,641 people shows a substantial positive correlation between the proportion of Irish and percentage of population with at least doctorate degree education in the United States with a correlation coefficient (R) of 0.518 and weighted average of 1.9%. Similarly, the statistical analysis conducted on geographies consisting of 222,674,417 people shows a weak negative correlation between the proportion of Immigrants from Trinidad and Tobago and percentage of population with at least doctorate degree education in the United States with a correlation coefficient (R) of -0.295 and weighted average of 1.5%, a difference of 27.9%.
Doctorate Degree Correlation Summary
| Measurement | Irish | Immigrants from Trinidad and Tobago |
| Minimum | 0.38% | 0.28% |
| Maximum | 40.0% | 3.0% |
| Range | 39.6% | 2.8% |
| Mean | 3.4% | 1.2% |
| Median | 2.0% | 1.2% |
| Interquartile 25% (IQ1) | 1.7% | 0.71% |
| Interquartile 75% (IQ3) | 2.3% | 1.6% |
| Interquartile Range (IQR) | 0.66% | 0.93% |
| Standard Deviation (Sample) | 6.1% | 0.63% |
| Standard Deviation (Population) | 6.0% | 0.63% |
Similar Demographics by Doctorate Degree
Demographics Similar to Irish by Doctorate Degree
In terms of doctorate degree, the demographic groups most similar to Irish are Czech (1.9%, a difference of 0.040%), Celtic (1.9%, a difference of 0.13%), Immigrants from Middle Africa (1.9%, a difference of 0.21%), Welsh (1.9%, a difference of 0.36%), and Slovene (1.9%, a difference of 0.45%).
| Demographics | Rating | Rank | Doctorate Degree |
| Poles | 72.7 /100 | #155 | Good 1.9% |
| Slavs | 72.4 /100 | #156 | Good 1.9% |
| Danes | 71.9 /100 | #157 | Good 1.9% |
| Hungarians | 71.7 /100 | #158 | Good 1.9% |
| Slovenes | 70.2 /100 | #159 | Good 1.9% |
| Welsh | 69.7 /100 | #160 | Good 1.9% |
| Immigrants | Middle Africa | 68.8 /100 | #161 | Good 1.9% |
| Irish | 67.5 /100 | #162 | Good 1.9% |
| Czechs | 67.3 /100 | #163 | Good 1.9% |
| Celtics | 66.7 /100 | #164 | Good 1.9% |
| Scotch-Irish | 63.6 /100 | #165 | Good 1.9% |
| Spaniards | 63.5 /100 | #166 | Good 1.9% |
| Macedonians | 60.9 /100 | #167 | Good 1.9% |
| Sri Lankans | 60.3 /100 | #168 | Good 1.9% |
| Vietnamese | 54.8 /100 | #169 | Average 1.9% |
Demographics Similar to Immigrants from Trinidad and Tobago by Doctorate Degree
In terms of doctorate degree, the demographic groups most similar to Immigrants from Trinidad and Tobago are Salvadoran (1.5%, a difference of 0.070%), Immigrants from Barbados (1.5%, a difference of 0.090%), Crow (1.5%, a difference of 0.10%), Kiowa (1.5%, a difference of 0.19%), and U.S. Virgin Islander (1.5%, a difference of 0.19%).
| Demographics | Rating | Rank | Doctorate Degree |
| Blackfeet | 0.7 /100 | #264 | Tragic 1.5% |
| Nicaraguans | 0.6 /100 | #265 | Tragic 1.5% |
| Immigrants | Liberia | 0.5 /100 | #266 | Tragic 1.5% |
| Kiowa | 0.5 /100 | #267 | Tragic 1.5% |
| U.S. Virgin Islanders | 0.5 /100 | #268 | Tragic 1.5% |
| Crow | 0.5 /100 | #269 | Tragic 1.5% |
| Salvadorans | 0.5 /100 | #270 | Tragic 1.5% |
| Immigrants | Trinidad and Tobago | 0.5 /100 | #271 | Tragic 1.5% |
| Immigrants | Barbados | 0.4 /100 | #272 | Tragic 1.5% |
| Sioux | 0.4 /100 | #273 | Tragic 1.5% |
| Yaqui | 0.4 /100 | #274 | Tragic 1.5% |
| Aleuts | 0.4 /100 | #275 | Tragic 1.5% |
| Paiute | 0.4 /100 | #276 | Tragic 1.5% |
| Bahamians | 0.4 /100 | #277 | Tragic 1.5% |
| Hawaiians | 0.4 /100 | #278 | Tragic 1.5% |