Irish vs Finnish Doctorate Degree
COMPARE
Irish
Finnish
Doctorate Degree
Doctorate Degree Comparison
Irish
Finns
1.9%
DOCTORATE DEGREE
67.5/ 100
METRIC RATING
162nd/ 347
METRIC RANK
1.8%
DOCTORATE DEGREE
42.1/ 100
METRIC RATING
183rd/ 347
METRIC RANK
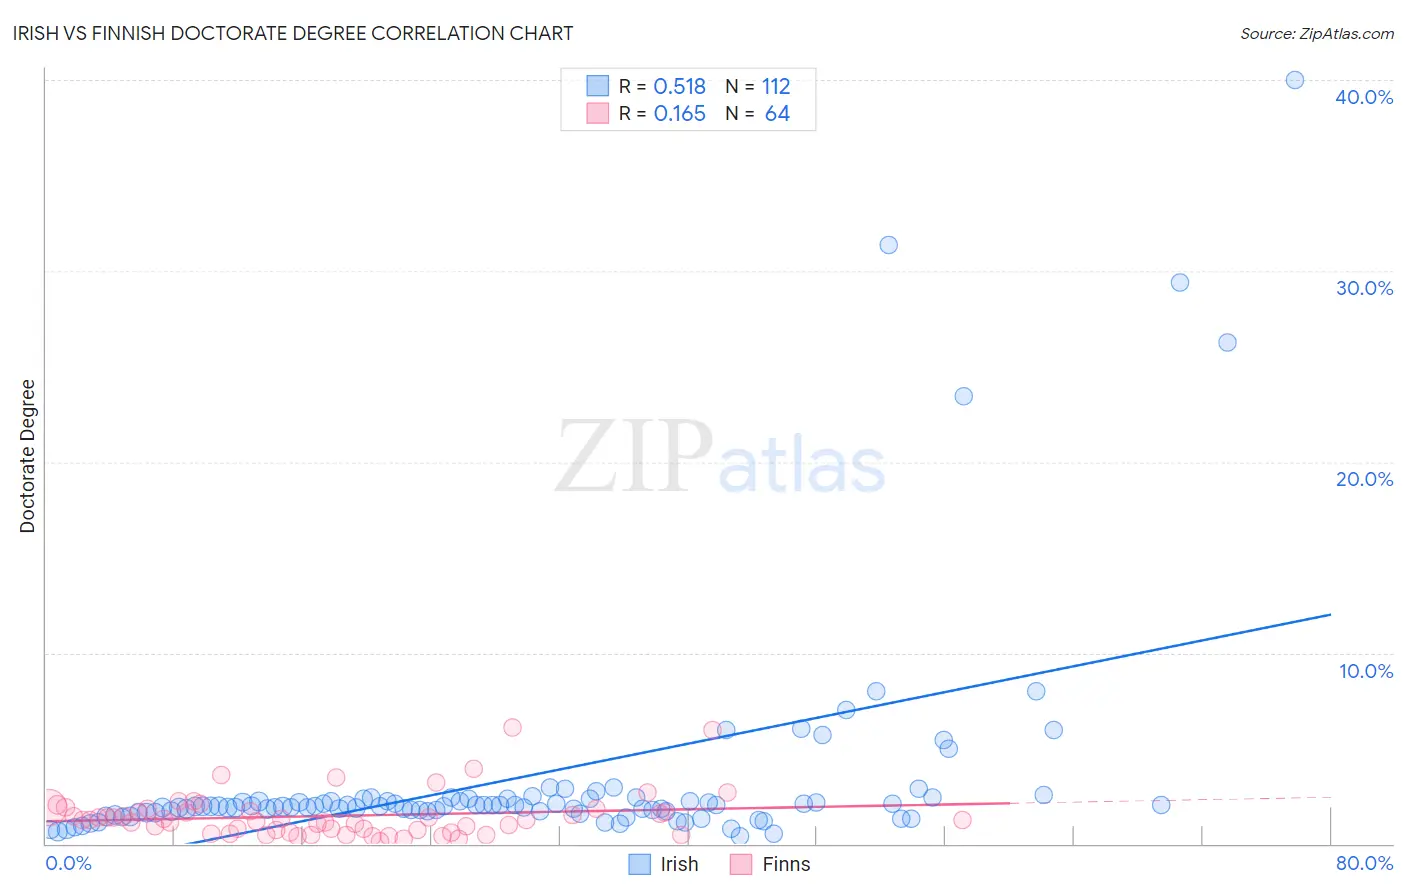
Irish vs Finnish Doctorate Degree Correlation Chart
The statistical analysis conducted on geographies consisting of 550,861,641 people shows a substantial positive correlation between the proportion of Irish and percentage of population with at least doctorate degree education in the United States with a correlation coefficient (R) of 0.518 and weighted average of 1.9%. Similarly, the statistical analysis conducted on geographies consisting of 399,063,308 people shows a poor positive correlation between the proportion of Finns and percentage of population with at least doctorate degree education in the United States with a correlation coefficient (R) of 0.165 and weighted average of 1.8%, a difference of 3.9%.
Doctorate Degree Correlation Summary
| Measurement | Irish | Finnish |
| Minimum | 0.38% | 0.15% |
| Maximum | 40.0% | 6.1% |
| Range | 39.6% | 5.9% |
| Mean | 3.4% | 1.5% |
| Median | 2.0% | 1.3% |
| Interquartile 25% (IQ1) | 1.7% | 0.66% |
| Interquartile 75% (IQ3) | 2.3% | 1.8% |
| Interquartile Range (IQR) | 0.66% | 1.1% |
| Standard Deviation (Sample) | 6.1% | 1.2% |
| Standard Deviation (Population) | 6.0% | 1.2% |
Similar Demographics by Doctorate Degree
Demographics Similar to Irish by Doctorate Degree
In terms of doctorate degree, the demographic groups most similar to Irish are Czech (1.9%, a difference of 0.040%), Celtic (1.9%, a difference of 0.13%), Immigrants from Middle Africa (1.9%, a difference of 0.21%), Welsh (1.9%, a difference of 0.36%), and Slovene (1.9%, a difference of 0.45%).
| Demographics | Rating | Rank | Doctorate Degree |
| Poles | 72.7 /100 | #155 | Good 1.9% |
| Slavs | 72.4 /100 | #156 | Good 1.9% |
| Danes | 71.9 /100 | #157 | Good 1.9% |
| Hungarians | 71.7 /100 | #158 | Good 1.9% |
| Slovenes | 70.2 /100 | #159 | Good 1.9% |
| Welsh | 69.7 /100 | #160 | Good 1.9% |
| Immigrants | Middle Africa | 68.8 /100 | #161 | Good 1.9% |
| Irish | 67.5 /100 | #162 | Good 1.9% |
| Czechs | 67.3 /100 | #163 | Good 1.9% |
| Celtics | 66.7 /100 | #164 | Good 1.9% |
| Scotch-Irish | 63.6 /100 | #165 | Good 1.9% |
| Spaniards | 63.5 /100 | #166 | Good 1.9% |
| Macedonians | 60.9 /100 | #167 | Good 1.9% |
| Sri Lankans | 60.3 /100 | #168 | Good 1.9% |
| Vietnamese | 54.8 /100 | #169 | Average 1.9% |
Demographics Similar to Finns by Doctorate Degree
In terms of doctorate degree, the demographic groups most similar to Finns are Nigerian (1.8%, a difference of 0.33%), Immigrants from Afghanistan (1.8%, a difference of 0.34%), Immigrants (1.8%, a difference of 0.63%), Scandinavian (1.8%, a difference of 0.89%), and Slovak (1.8%, a difference of 0.90%).
| Demographics | Rating | Rank | Doctorate Degree |
| Spanish | 49.3 /100 | #176 | Average 1.8% |
| Iraqis | 49.2 /100 | #177 | Average 1.8% |
| French | 48.8 /100 | #178 | Average 1.8% |
| Ghanaians | 48.3 /100 | #179 | Average 1.8% |
| Scandinavians | 48.0 /100 | #180 | Average 1.8% |
| Immigrants | Immigrants | 46.2 /100 | #181 | Average 1.8% |
| Immigrants | Afghanistan | 44.3 /100 | #182 | Average 1.8% |
| Finns | 42.1 /100 | #183 | Average 1.8% |
| Nigerians | 39.9 /100 | #184 | Fair 1.8% |
| Slovaks | 36.4 /100 | #185 | Fair 1.8% |
| Peruvians | 34.4 /100 | #186 | Fair 1.8% |
| Czechoslovakians | 33.0 /100 | #187 | Fair 1.8% |
| Germans | 30.5 /100 | #188 | Fair 1.8% |
| French Canadians | 30.2 /100 | #189 | Fair 1.8% |
| Immigrants | Costa Rica | 30.2 /100 | #190 | Fair 1.8% |