Indonesian vs Immigrants from Poland Bachelor's Degree
COMPARE
Indonesian
Immigrants from Poland
Bachelor's Degree
Bachelor's Degree Comparison
Indonesians
Immigrants from Poland
33.5%
BACHELOR'S DEGREE
0.9/ 100
METRIC RATING
250th/ 347
METRIC RANK
39.0%
BACHELOR'S DEGREE
77.5/ 100
METRIC RATING
149th/ 347
METRIC RANK
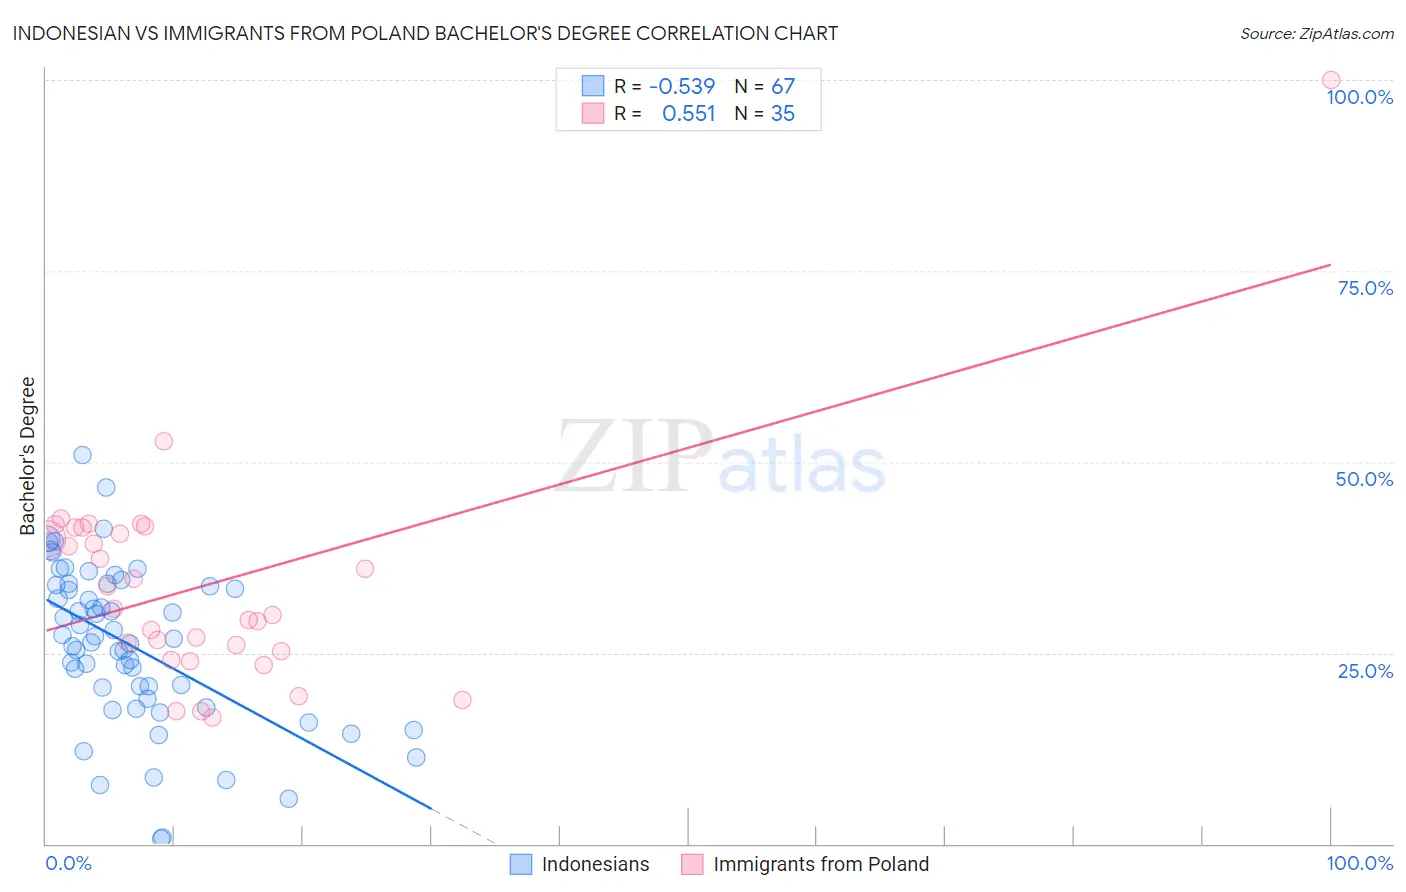
Indonesian vs Immigrants from Poland Bachelor's Degree Correlation Chart
The statistical analysis conducted on geographies consisting of 162,716,505 people shows a substantial negative correlation between the proportion of Indonesians and percentage of population with at least bachelor's degree education in the United States with a correlation coefficient (R) of -0.539 and weighted average of 33.5%. Similarly, the statistical analysis conducted on geographies consisting of 304,854,598 people shows a substantial positive correlation between the proportion of Immigrants from Poland and percentage of population with at least bachelor's degree education in the United States with a correlation coefficient (R) of 0.551 and weighted average of 39.0%, a difference of 16.2%.
Bachelor's Degree Correlation Summary
| Measurement | Indonesian | Immigrants from Poland |
| Minimum | 0.73% | 16.6% |
| Maximum | 50.9% | 100.0% |
| Range | 50.2% | 83.4% |
| Mean | 26.1% | 33.8% |
| Median | 26.9% | 30.8% |
| Interquartile 25% (IQ1) | 19.0% | 25.2% |
| Interquartile 75% (IQ3) | 33.9% | 41.4% |
| Interquartile Range (IQR) | 14.9% | 16.2% |
| Standard Deviation (Sample) | 10.5% | 14.7% |
| Standard Deviation (Population) | 10.4% | 14.5% |
Similar Demographics by Bachelor's Degree
Demographics Similar to Indonesians by Bachelor's Degree
In terms of bachelor's degree, the demographic groups most similar to Indonesians are Immigrants from Liberia (33.5%, a difference of 0.010%), Cree (33.6%, a difference of 0.13%), Immigrants from Congo (33.6%, a difference of 0.15%), Jamaican (33.6%, a difference of 0.24%), and Immigrants from Fiji (33.7%, a difference of 0.60%).
| Demographics | Rating | Rank | Bachelor's Degree |
| Immigrants | Guyana | 1.4 /100 | #243 | Tragic 33.9% |
| Delaware | 1.2 /100 | #244 | Tragic 33.8% |
| Immigrants | Fiji | 1.2 /100 | #245 | Tragic 33.7% |
| Jamaicans | 1.0 /100 | #246 | Tragic 33.6% |
| Immigrants | Congo | 1.0 /100 | #247 | Tragic 33.6% |
| Cree | 1.0 /100 | #248 | Tragic 33.6% |
| Immigrants | Liberia | 0.9 /100 | #249 | Tragic 33.5% |
| Indonesians | 0.9 /100 | #250 | Tragic 33.5% |
| Japanese | 0.7 /100 | #251 | Tragic 33.3% |
| Immigrants | Bahamas | 0.7 /100 | #252 | Tragic 33.3% |
| U.S. Virgin Islanders | 0.7 /100 | #253 | Tragic 33.2% |
| Native Hawaiians | 0.7 /100 | #254 | Tragic 33.2% |
| Iroquois | 0.7 /100 | #255 | Tragic 33.2% |
| Nicaraguans | 0.6 /100 | #256 | Tragic 33.1% |
| Spanish Americans | 0.6 /100 | #257 | Tragic 33.1% |
Demographics Similar to Immigrants from Poland by Bachelor's Degree
In terms of bachelor's degree, the demographic groups most similar to Immigrants from Poland are South American (38.9%, a difference of 0.030%), Iraqi (39.0%, a difference of 0.080%), Immigrants from Africa (38.9%, a difference of 0.13%), Sudanese (38.9%, a difference of 0.15%), and Slavic (38.9%, a difference of 0.20%).
| Demographics | Rating | Rank | Bachelor's Degree |
| Immigrants | North Macedonia | 81.6 /100 | #142 | Excellent 39.2% |
| Poles | 79.8 /100 | #143 | Good 39.1% |
| Immigrants | Afghanistan | 79.7 /100 | #144 | Good 39.1% |
| Slovenes | 79.5 /100 | #145 | Good 39.1% |
| Swedes | 79.2 /100 | #146 | Good 39.1% |
| Immigrants | Sierra Leone | 79.0 /100 | #147 | Good 39.0% |
| Iraqis | 78.1 /100 | #148 | Good 39.0% |
| Immigrants | Poland | 77.5 /100 | #149 | Good 39.0% |
| South Americans | 77.3 /100 | #150 | Good 38.9% |
| Immigrants | Africa | 76.5 /100 | #151 | Good 38.9% |
| Sudanese | 76.4 /100 | #152 | Good 38.9% |
| Slavs | 75.9 /100 | #153 | Good 38.9% |
| Canadians | 75.0 /100 | #154 | Good 38.8% |
| Immigrants | Kenya | 73.8 /100 | #155 | Good 38.8% |
| Kenyans | 72.5 /100 | #156 | Good 38.7% |