Indonesian vs Immigrants from Nepal Bachelor's Degree
COMPARE
Indonesian
Immigrants from Nepal
Bachelor's Degree
Bachelor's Degree Comparison
Indonesians
Immigrants from Nepal
33.5%
BACHELOR'S DEGREE
0.9/ 100
METRIC RATING
250th/ 347
METRIC RANK
41.7%
BACHELOR'S DEGREE
98.6/ 100
METRIC RATING
94th/ 347
METRIC RANK
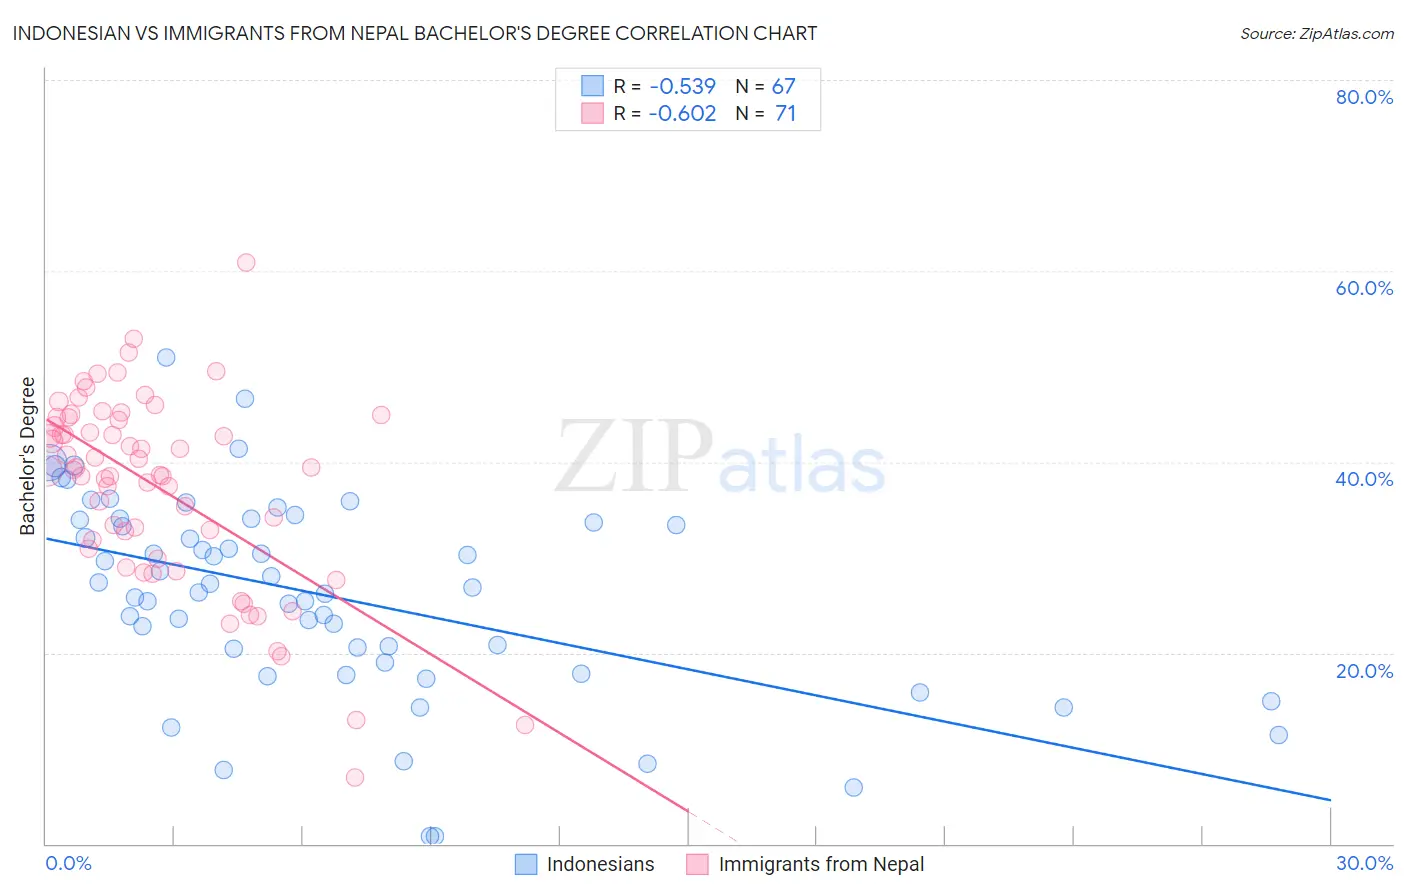
Indonesian vs Immigrants from Nepal Bachelor's Degree Correlation Chart
The statistical analysis conducted on geographies consisting of 162,716,505 people shows a substantial negative correlation between the proportion of Indonesians and percentage of population with at least bachelor's degree education in the United States with a correlation coefficient (R) of -0.539 and weighted average of 33.5%. Similarly, the statistical analysis conducted on geographies consisting of 186,767,896 people shows a significant negative correlation between the proportion of Immigrants from Nepal and percentage of population with at least bachelor's degree education in the United States with a correlation coefficient (R) of -0.602 and weighted average of 41.7%, a difference of 24.4%.
Bachelor's Degree Correlation Summary
| Measurement | Indonesian | Immigrants from Nepal |
| Minimum | 0.73% | 7.0% |
| Maximum | 50.9% | 60.9% |
| Range | 50.2% | 53.9% |
| Mean | 26.1% | 37.3% |
| Median | 26.9% | 39.2% |
| Interquartile 25% (IQ1) | 19.0% | 30.9% |
| Interquartile 75% (IQ3) | 33.9% | 44.6% |
| Interquartile Range (IQR) | 14.9% | 13.7% |
| Standard Deviation (Sample) | 10.5% | 10.1% |
| Standard Deviation (Population) | 10.4% | 10.0% |
Similar Demographics by Bachelor's Degree
Demographics Similar to Indonesians by Bachelor's Degree
In terms of bachelor's degree, the demographic groups most similar to Indonesians are Immigrants from Liberia (33.5%, a difference of 0.010%), Cree (33.6%, a difference of 0.13%), Immigrants from Congo (33.6%, a difference of 0.15%), Jamaican (33.6%, a difference of 0.24%), and Immigrants from Fiji (33.7%, a difference of 0.60%).
| Demographics | Rating | Rank | Bachelor's Degree |
| Immigrants | Guyana | 1.4 /100 | #243 | Tragic 33.9% |
| Delaware | 1.2 /100 | #244 | Tragic 33.8% |
| Immigrants | Fiji | 1.2 /100 | #245 | Tragic 33.7% |
| Jamaicans | 1.0 /100 | #246 | Tragic 33.6% |
| Immigrants | Congo | 1.0 /100 | #247 | Tragic 33.6% |
| Cree | 1.0 /100 | #248 | Tragic 33.6% |
| Immigrants | Liberia | 0.9 /100 | #249 | Tragic 33.5% |
| Indonesians | 0.9 /100 | #250 | Tragic 33.5% |
| Japanese | 0.7 /100 | #251 | Tragic 33.3% |
| Immigrants | Bahamas | 0.7 /100 | #252 | Tragic 33.3% |
| U.S. Virgin Islanders | 0.7 /100 | #253 | Tragic 33.2% |
| Native Hawaiians | 0.7 /100 | #254 | Tragic 33.2% |
| Iroquois | 0.7 /100 | #255 | Tragic 33.2% |
| Nicaraguans | 0.6 /100 | #256 | Tragic 33.1% |
| Spanish Americans | 0.6 /100 | #257 | Tragic 33.1% |
Demographics Similar to Immigrants from Nepal by Bachelor's Degree
In terms of bachelor's degree, the demographic groups most similar to Immigrants from Nepal are Immigrants from Canada (41.7%, a difference of 0.020%), Immigrants from North America (41.7%, a difference of 0.12%), Immigrants from Moldova (41.6%, a difference of 0.23%), Romanian (41.6%, a difference of 0.29%), and Immigrants from Ukraine (41.5%, a difference of 0.40%).
| Demographics | Rating | Rank | Bachelor's Degree |
| Carpatho Rusyns | 99.0 /100 | #87 | Exceptional 42.1% |
| Immigrants | Western Europe | 99.0 /100 | #88 | Exceptional 42.0% |
| Greeks | 99.0 /100 | #89 | Exceptional 42.0% |
| Laotians | 98.9 /100 | #90 | Exceptional 42.0% |
| Immigrants | Northern Africa | 98.9 /100 | #91 | Exceptional 41.9% |
| Maltese | 98.8 /100 | #92 | Exceptional 41.9% |
| Immigrants | Canada | 98.6 /100 | #93 | Exceptional 41.7% |
| Immigrants | Nepal | 98.6 /100 | #94 | Exceptional 41.7% |
| Immigrants | North America | 98.5 /100 | #95 | Exceptional 41.7% |
| Immigrants | Moldova | 98.4 /100 | #96 | Exceptional 41.6% |
| Romanians | 98.4 /100 | #97 | Exceptional 41.6% |
| Immigrants | Ukraine | 98.3 /100 | #98 | Exceptional 41.5% |
| Immigrants | England | 98.1 /100 | #99 | Exceptional 41.4% |
| Macedonians | 98.1 /100 | #100 | Exceptional 41.4% |
| Immigrants | Morocco | 98.0 /100 | #101 | Exceptional 41.4% |