Immigrants from Zimbabwe vs Immigrants from Uganda Professional Degree
COMPARE
Immigrants from Zimbabwe
Immigrants from Uganda
Professional Degree
Professional Degree Comparison
Immigrants from Zimbabwe
Immigrants from Uganda
5.3%
PROFESSIONAL DEGREE
99.6/ 100
METRIC RATING
85th/ 347
METRIC RANK
5.0%
PROFESSIONAL DEGREE
98.2/ 100
METRIC RATING
105th/ 347
METRIC RANK
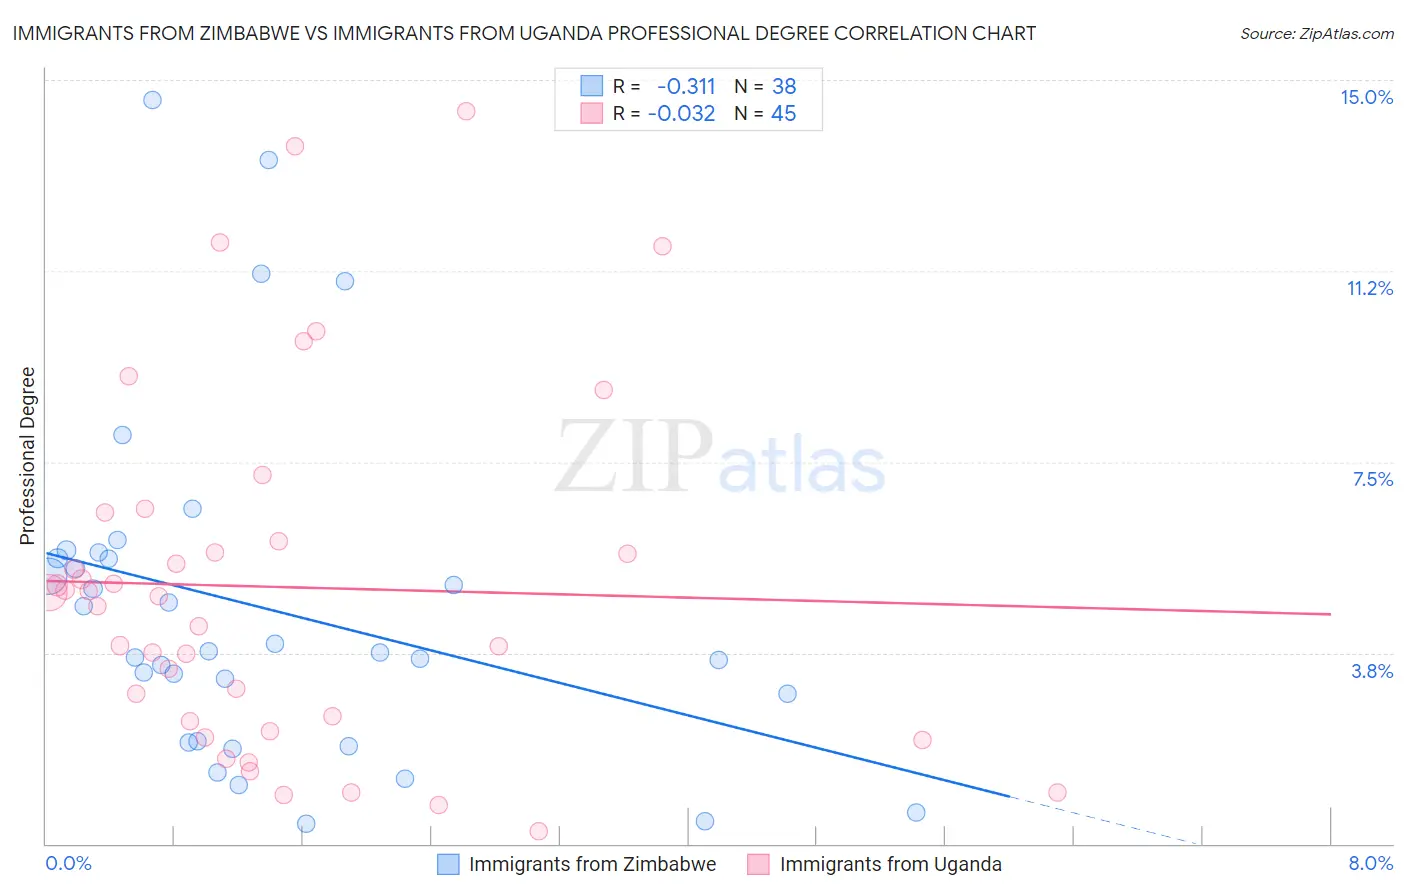
Immigrants from Zimbabwe vs Immigrants from Uganda Professional Degree Correlation Chart
The statistical analysis conducted on geographies consisting of 117,758,651 people shows a mild negative correlation between the proportion of Immigrants from Zimbabwe and percentage of population with at least professional degree education in the United States with a correlation coefficient (R) of -0.311 and weighted average of 5.3%. Similarly, the statistical analysis conducted on geographies consisting of 125,927,625 people shows no correlation between the proportion of Immigrants from Uganda and percentage of population with at least professional degree education in the United States with a correlation coefficient (R) of -0.032 and weighted average of 5.0%, a difference of 4.5%.
Professional Degree Correlation Summary
| Measurement | Immigrants from Zimbabwe | Immigrants from Uganda |
| Minimum | 0.39% | 0.24% |
| Maximum | 14.6% | 14.4% |
| Range | 14.2% | 14.2% |
| Mean | 4.6% | 5.0% |
| Median | 3.8% | 4.9% |
| Interquartile 25% (IQ1) | 2.0% | 2.3% |
| Interquartile 75% (IQ3) | 5.6% | 6.2% |
| Interquartile Range (IQR) | 3.6% | 3.9% |
| Standard Deviation (Sample) | 3.3% | 3.5% |
| Standard Deviation (Population) | 3.3% | 3.4% |
Demographics Similar to Immigrants from Zimbabwe and Immigrants from Uganda by Professional Degree
In terms of professional degree, the demographic groups most similar to Immigrants from Zimbabwe are Greek (5.3%, a difference of 0.0%), Immigrants from Chile (5.3%, a difference of 0.11%), Egyptian (5.3%, a difference of 0.25%), Chilean (5.3%, a difference of 0.25%), and Immigrants from Scotland (5.3%, a difference of 0.35%). Similarly, the demographic groups most similar to Immigrants from Uganda are Arab (5.0%, a difference of 0.020%), Immigrants from Northern Africa (5.1%, a difference of 0.34%), Ukrainian (5.1%, a difference of 0.59%), Immigrants from Egypt (5.1%, a difference of 0.67%), and Ugandan (5.1%, a difference of 1.4%).
| Demographics | Rating | Rank | Professional Degree |
| Immigrants | Zimbabwe | 99.6 /100 | #85 | Exceptional 5.3% |
| Greeks | 99.6 /100 | #86 | Exceptional 5.3% |
| Immigrants | Chile | 99.5 /100 | #87 | Exceptional 5.3% |
| Egyptians | 99.5 /100 | #88 | Exceptional 5.3% |
| Chileans | 99.5 /100 | #89 | Exceptional 5.3% |
| Immigrants | Scotland | 99.5 /100 | #90 | Exceptional 5.3% |
| Laotians | 99.5 /100 | #91 | Exceptional 5.2% |
| Immigrants | Eastern Europe | 99.5 /100 | #92 | Exceptional 5.2% |
| Northern Europeans | 99.3 /100 | #93 | Exceptional 5.2% |
| Alsatians | 99.3 /100 | #94 | Exceptional 5.2% |
| Zimbabweans | 99.3 /100 | #95 | Exceptional 5.2% |
| Immigrants | Uzbekistan | 99.2 /100 | #96 | Exceptional 5.2% |
| Syrians | 99.1 /100 | #97 | Exceptional 5.2% |
| Austrians | 99.1 /100 | #98 | Exceptional 5.2% |
| Immigrants | Italy | 99.1 /100 | #99 | Exceptional 5.2% |
| Ugandans | 98.8 /100 | #100 | Exceptional 5.1% |
| Immigrants | Egypt | 98.5 /100 | #101 | Exceptional 5.1% |
| Ukrainians | 98.5 /100 | #102 | Exceptional 5.1% |
| Immigrants | Northern Africa | 98.4 /100 | #103 | Exceptional 5.1% |
| Arabs | 98.2 /100 | #104 | Exceptional 5.0% |
| Immigrants | Uganda | 98.2 /100 | #105 | Exceptional 5.0% |