Comanche vs Immigrants from Uganda Professional Degree
COMPARE
Comanche
Immigrants from Uganda
Professional Degree
Professional Degree Comparison
Comanche
Immigrants from Uganda
3.5%
PROFESSIONAL DEGREE
0.4/ 100
METRIC RATING
283rd/ 347
METRIC RANK
5.0%
PROFESSIONAL DEGREE
98.2/ 100
METRIC RATING
105th/ 347
METRIC RANK
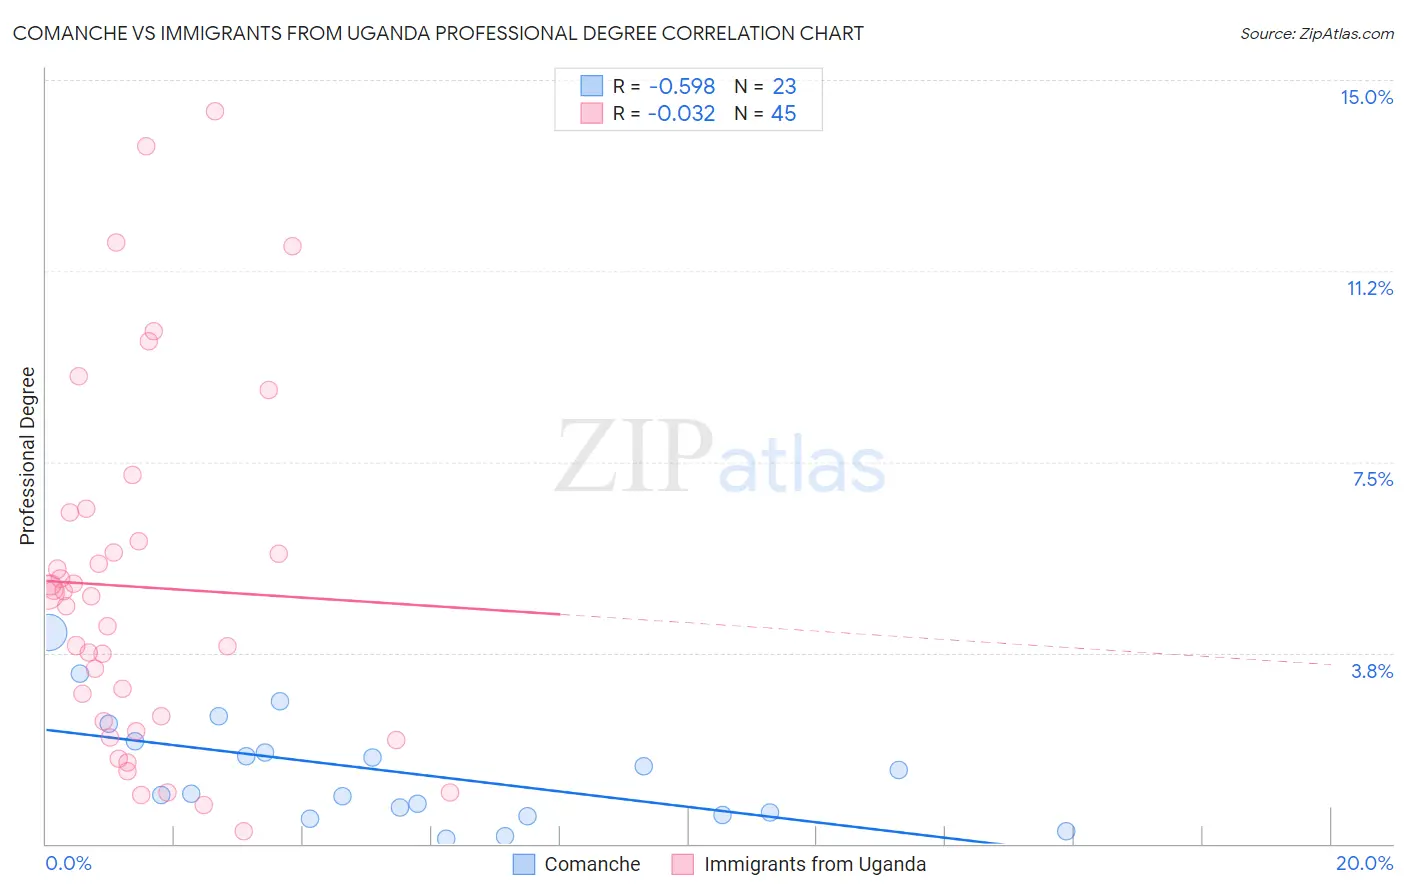
Comanche vs Immigrants from Uganda Professional Degree Correlation Chart
The statistical analysis conducted on geographies consisting of 109,559,847 people shows a substantial negative correlation between the proportion of Comanche and percentage of population with at least professional degree education in the United States with a correlation coefficient (R) of -0.598 and weighted average of 3.5%. Similarly, the statistical analysis conducted on geographies consisting of 125,927,625 people shows no correlation between the proportion of Immigrants from Uganda and percentage of population with at least professional degree education in the United States with a correlation coefficient (R) of -0.032 and weighted average of 5.0%, a difference of 42.7%.
Professional Degree Correlation Summary
| Measurement | Comanche | Immigrants from Uganda |
| Minimum | 0.11% | 0.24% |
| Maximum | 4.1% | 14.4% |
| Range | 4.0% | 14.2% |
| Mean | 1.4% | 5.0% |
| Median | 0.97% | 4.9% |
| Interquartile 25% (IQ1) | 0.57% | 2.3% |
| Interquartile 75% (IQ3) | 2.0% | 6.2% |
| Interquartile Range (IQR) | 1.4% | 3.9% |
| Standard Deviation (Sample) | 1.1% | 3.5% |
| Standard Deviation (Population) | 1.0% | 3.4% |
Similar Demographics by Professional Degree
Demographics Similar to Comanche by Professional Degree
In terms of professional degree, the demographic groups most similar to Comanche are Salvadoran (3.5%, a difference of 0.10%), Immigrants from Caribbean (3.5%, a difference of 0.30%), Apache (3.5%, a difference of 0.32%), Dominican (3.5%, a difference of 0.34%), and Immigrants from Portugal (3.5%, a difference of 0.38%).
| Demographics | Rating | Rank | Professional Degree |
| Liberians | 0.5 /100 | #276 | Tragic 3.6% |
| Cheyenne | 0.5 /100 | #277 | Tragic 3.6% |
| Japanese | 0.5 /100 | #278 | Tragic 3.5% |
| Immigrants | Portugal | 0.5 /100 | #279 | Tragic 3.5% |
| Dominicans | 0.5 /100 | #280 | Tragic 3.5% |
| Apache | 0.5 /100 | #281 | Tragic 3.5% |
| Immigrants | Caribbean | 0.5 /100 | #282 | Tragic 3.5% |
| Comanche | 0.4 /100 | #283 | Tragic 3.5% |
| Salvadorans | 0.4 /100 | #284 | Tragic 3.5% |
| Hondurans | 0.3 /100 | #285 | Tragic 3.5% |
| Haitians | 0.3 /100 | #286 | Tragic 3.5% |
| Immigrants | El Salvador | 0.3 /100 | #287 | Tragic 3.5% |
| Blackfeet | 0.3 /100 | #288 | Tragic 3.5% |
| Guatemalans | 0.3 /100 | #289 | Tragic 3.5% |
| Chippewa | 0.3 /100 | #290 | Tragic 3.5% |
Demographics Similar to Immigrants from Uganda by Professional Degree
In terms of professional degree, the demographic groups most similar to Immigrants from Uganda are Arab (5.0%, a difference of 0.020%), Immigrants from Ukraine (5.0%, a difference of 0.030%), Maltese (5.0%, a difference of 0.15%), Immigrants from Southern Europe (5.0%, a difference of 0.19%), and British (5.0%, a difference of 0.21%).
| Demographics | Rating | Rank | Professional Degree |
| Austrians | 99.1 /100 | #98 | Exceptional 5.2% |
| Immigrants | Italy | 99.1 /100 | #99 | Exceptional 5.2% |
| Ugandans | 98.8 /100 | #100 | Exceptional 5.1% |
| Immigrants | Egypt | 98.5 /100 | #101 | Exceptional 5.1% |
| Ukrainians | 98.5 /100 | #102 | Exceptional 5.1% |
| Immigrants | Northern Africa | 98.4 /100 | #103 | Exceptional 5.1% |
| Arabs | 98.2 /100 | #104 | Exceptional 5.0% |
| Immigrants | Uganda | 98.2 /100 | #105 | Exceptional 5.0% |
| Immigrants | Ukraine | 98.2 /100 | #106 | Exceptional 5.0% |
| Maltese | 98.1 /100 | #107 | Exceptional 5.0% |
| Immigrants | Southern Europe | 98.1 /100 | #108 | Exceptional 5.0% |
| British | 98.0 /100 | #109 | Exceptional 5.0% |
| Lebanese | 98.0 /100 | #110 | Exceptional 5.0% |
| Brazilians | 97.4 /100 | #111 | Exceptional 5.0% |
| Taiwanese | 97.3 /100 | #112 | Exceptional 5.0% |