Immigrants from Yemen vs Immigrants from Ireland 11th Grade

COMPARE

Immigrants from Yemen
Race
Ancestry
AfghanAfricanAlaska NativeAlaskan AthabascanAlbanianAleutAlsatianAmericanApacheArabArapahoArgentineanArmenianAssyrian/Chaldean/SyriacAustralianAustrianBahamianBangladeshiBarbadianBasqueBelgianBelizeanBermudanBhutaneseBlackfeetBolivianBrazilianBritishBritish West IndianBulgarianBurmeseCajunCambodianCanadianCape VerdeanCarpatho RusynCelticCentral AmericanCentral American IndianCherokeeCheyenneChickasawChileanChineseChippewaChoctawColombianColvilleComancheCosta RicanCreeCreekCroatianCrowCubanCypriotCzechCzechoslovakianDanishDelawareDominicanDutchDutch West IndianEastern EuropeanEcuadorianEgyptianEnglishEstonianEthiopianEuropeanFijianFilipinoFinnishFrenchFrench American IndianFrench CanadianGermanGerman RussianGhanaianGreekGuamanian/ChamorroGuatemalanGuyaneseHaitianHmongHonduranHopiHoumaHungarianIcelanderIndian (Asian)IndonesianInupiatIranianIraqiIrishIroquoisIsraeliItalianJamaicanJapaneseJordanianKenyanKiowaKoreanLaotianLatvianLebaneseLiberianLithuanianLumbeeLuxembourgerMacedonianMalaysianMalteseMarshalleseMenomineeMexicanMexican American IndianMongolianMoroccanNative HawaiianNavajoNepaleseNew ZealanderNicaraguanNigerianNorthern EuropeanNorwegianOkinawanOsageOttawaPaiutePakistaniPalestinianPanamanianParaguayanPennsylvania GermanPeruvianPimaPolishPortuguesePotawatomiPuebloPuerto RicanPuget Sound SalishRomanianRussianSalvadoranSamoanScandinavianScotch-IrishScottishSeminoleSenegaleseSerbianShoshoneSierra LeoneanSiouxSlavicSlovakSloveneSomaliSouth AfricanSouth AmericanSouth American IndianSoviet UnionSpaniardSpanishSpanish AmericanSpanish American IndianSri LankanSubsaharan AfricanSudaneseSwedishSwissSyrianTaiwaneseThaiTlingit-HaidaTohono O'OdhamTonganTrinidadian and TobagonianTsimshianTurkishU.S. Virgin IslanderUgandanUkrainianUruguayanUteVenezuelanVietnameseWelshWest IndianYakamaYaquiYugoslavianYumanYup'ikZimbabwean
Immigration
NonimmigrantsImmigrantsAfghanistanAfricaAlbaniaArgentinaArmeniaAsiaAustraliaAustriaBahamasBangladeshBarbadosBelarusBelgiumBelizeBoliviaBosnia and HerzegovinaBrazilBulgariaBurma/MyanmarCabo VerdeCambodiaCameroonCanadaCaribbeanCentral AmericaChileChinaColombiaCongoCosta RicaCroatiaCubaCzechoslovakiaDenmarkDominicaDominican RepublicEastern AfricaEastern AsiaEastern EuropeEcuadorEgyptEl SalvadorEnglandEritreaEthiopiaEuropeFijiFranceGermanyGhanaGreeceGrenadaGuatemalaGuyanaHaitiHondurasHong KongHungaryIndiaIndonesiaIranIraqIsraelItalyJamaicaJapanJordanKazakhstanKenyaKoreaKuwaitLaosLatin AmericaLatviaLebanonLiberiaLithuaniaMalaysiaMexicoMicronesiaMiddle AfricaMoldovaMoroccoNepalNetherlandsNicaraguaNigeriaNorth AmericaNorth MacedoniaNorthern AfricaNorthern EuropeNorwayOceaniaPakistanPanamaPeruPhilippinesPolandPortugalRomaniaRussiaSaudi ArabiaScotlandSenegalSerbiaSierra LeoneSingaporeSomaliaSouth AfricaSouth AmericaSouth Central AsiaSouth Eastern AsiaSouthern EuropeSpainSri LankaSt. Vincent and the GrenadinesSudanSwedenSwitzerlandSyriaTaiwanThailandTrinidad and TobagoTurkeyUgandaUkraineUruguayUzbekistanVenezuelaVietnamWest IndiesWestern AfricaWestern AsiaWestern EuropeYemenZaireZimbabweAzores
Immigrants from Ireland
Race
Ancestry
AfghanAfricanAlaska NativeAlaskan AthabascanAlbanianAleutAlsatianAmericanApacheArabArapahoArgentineanArmenianAssyrian/Chaldean/SyriacAustralianAustrianBahamianBangladeshiBarbadianBasqueBelgianBelizeanBermudanBhutaneseBlackfeetBolivianBrazilianBritishBritish West IndianBulgarianBurmeseCajunCambodianCanadianCape VerdeanCarpatho RusynCelticCentral AmericanCentral American IndianCherokeeCheyenneChickasawChileanChineseChippewaChoctawColombianColvilleComancheCosta RicanCreeCreekCroatianCrowCubanCypriotCzechCzechoslovakianDanishDelawareDominicanDutchDutch West IndianEastern EuropeanEcuadorianEgyptianEnglishEstonianEthiopianEuropeanFijianFilipinoFinnishFrenchFrench American IndianFrench CanadianGermanGerman RussianGhanaianGreekGuamanian/ChamorroGuatemalanGuyaneseHaitianHmongHonduranHopiHoumaHungarianIcelanderIndian (Asian)IndonesianInupiatIranianIraqiIrishIroquoisIsraeliItalianJamaicanJapaneseJordanianKenyanKiowaKoreanLaotianLatvianLebaneseLiberianLithuanianLumbeeLuxembourgerMacedonianMalaysianMalteseMarshalleseMenomineeMexicanMexican American IndianMongolianMoroccanNative HawaiianNavajoNepaleseNew ZealanderNicaraguanNigerianNorthern EuropeanNorwegianOkinawanOsageOttawaPaiutePakistaniPalestinianPanamanianParaguayanPennsylvania GermanPeruvianPimaPolishPortuguesePotawatomiPuebloPuerto RicanPuget Sound SalishRomanianRussianSalvadoranSamoanScandinavianScotch-IrishScottishSeminoleSenegaleseSerbianShoshoneSierra LeoneanSiouxSlavicSlovakSloveneSomaliSouth AfricanSouth AmericanSouth American IndianSoviet UnionSpaniardSpanishSpanish AmericanSpanish American IndianSri LankanSubsaharan AfricanSudaneseSwedishSwissSyrianTaiwaneseThaiTlingit-HaidaTohono O'OdhamTonganTrinidadian and TobagonianTsimshianTurkishU.S. Virgin IslanderUgandanUkrainianUruguayanUteVenezuelanVietnameseWelshWest IndianYakamaYaquiYugoslavianYumanYup'ikZimbabwean
Immigration
NonimmigrantsImmigrantsAfghanistanAfricaAlbaniaArgentinaArmeniaAsiaAustraliaAustriaBahamasBangladeshBarbadosBelarusBelgiumBelizeBoliviaBosnia and HerzegovinaBrazilBulgariaBurma/MyanmarCabo VerdeCambodiaCameroonCanadaCaribbeanCentral AmericaChileChinaColombiaCongoCosta RicaCroatiaCubaCzechoslovakiaDenmarkDominicaDominican RepublicEastern AfricaEastern AsiaEastern EuropeEcuadorEgyptEl SalvadorEnglandEritreaEthiopiaEuropeFijiFranceGermanyGhanaGreeceGrenadaGuatemalaGuyanaHaitiHondurasHong KongHungaryIndiaIndonesiaIranIraqIrelandIsraelItalyJamaicaJapanJordanKazakhstanKenyaKoreaKuwaitLaosLatin AmericaLatviaLebanonLiberiaLithuaniaMalaysiaMexicoMicronesiaMiddle AfricaMoldovaMoroccoNepalNetherlandsNicaraguaNigeriaNorth AmericaNorth MacedoniaNorthern AfricaNorthern EuropeNorwayOceaniaPakistanPanamaPeruPhilippinesPolandPortugalRomaniaRussiaSaudi ArabiaScotlandSenegalSerbiaSierra LeoneSingaporeSomaliaSouth AfricaSouth AmericaSouth Central AsiaSouth Eastern AsiaSouthern EuropeSpainSri LankaSt. Vincent and the GrenadinesSudanSwedenSwitzerlandSyriaTaiwanThailandTrinidad and TobagoTurkeyUgandaUkraineUruguayUzbekistanVenezuelaVietnamWest IndiesWestern AfricaWestern AsiaWestern EuropeZaireZimbabweAzores
11th Grade
Income
Poverty
Unemployment
Labor Participation
Family Structure
Vehicle Availability
Education Level
Disability

11th Grade Comparison

Immigrants from Yemen

Immigrants from Ireland

Tragic
Exceptional
87.1%
11TH GRADE
0.0/ 100
METRIC RATING
333rd/ 347
METRIC RANK
94.1%
11TH GRADE
99.9/ 100
METRIC RATING
44th/ 347
METRIC RANK

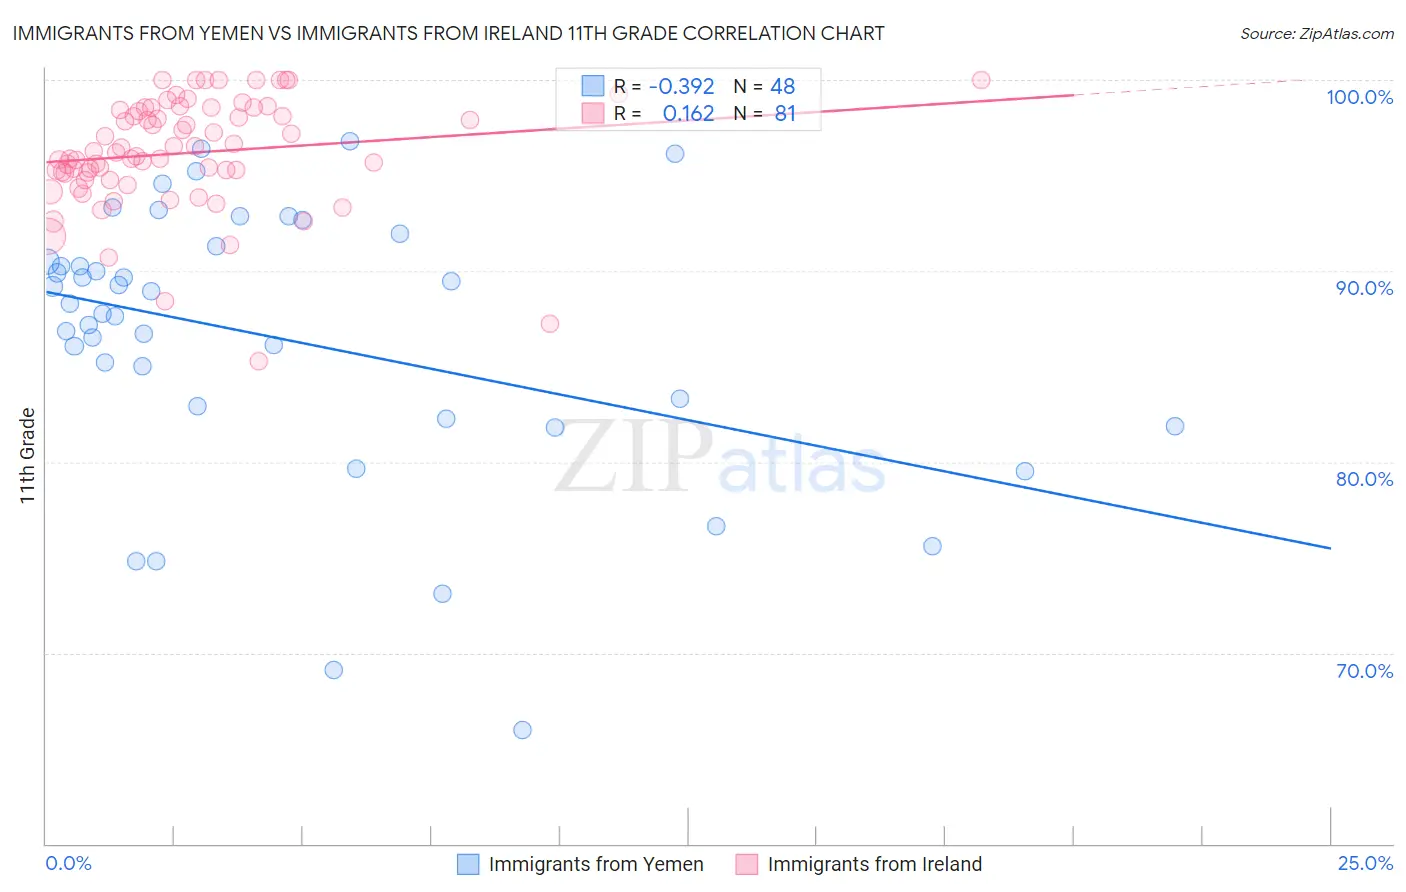
Immigrants from Yemen vs Immigrants from Ireland 11th Grade Correlation Chart

The statistical analysis conducted on geographies consisting of 82,421,120 people shows a mild negative correlation between the proportion of Immigrants from Yemen and percentage of population with at least 11th grade education in the United States with a correlation coefficient (R) of -0.392 and weighted average of 87.1%. Similarly, the statistical analysis conducted on geographies consisting of 240,784,498 people shows a poor positive correlation between the proportion of Immigrants from Ireland and percentage of population with at least 11th grade education in the United States with a correlation coefficient (R) of 0.162 and weighted average of 94.1%, a difference of 8.1%.
Immigrants from Yemen vs Immigrants from Ireland 11th Grade

11th Grade Correlation Summary

MeasurementImmigrants from YemenImmigrants from Ireland
Minimum66.0%85.3%
Maximum96.8%100.0%
Range30.8%14.7%
Mean86.4%96.2%
Median88.0%96.2%
Interquartile 25% (IQ1)82.6%95.0%
Interquartile 75% (IQ3)90.9%98.5%
Interquartile Range (IQR)8.3%3.5%
Standard Deviation (Sample)7.2%2.9%
Standard Deviation (Population)7.1%2.9%

Similar Demographics by 11th Grade

Demographics Similar to Immigrants from Yemen by 11th Grade

In terms of 11th grade, the demographic groups most similar to Immigrants from Yemen are Houma (87.0%, a difference of 0.060%), Central American (86.9%, a difference of 0.16%), Immigrants from the Azores (87.2%, a difference of 0.17%), Immigrants from Dominican Republic (86.9%, a difference of 0.20%), and Immigrants from Honduras (86.9%, a difference of 0.21%).
DemographicsRating | Rank11th Grade
Dominicans
0.0
/100
|
#326
Tragic
87.7%
Immigrants | Cabo Verde
0.0
/100
|
#327
Tragic
87.6%
Tohono O'odham
0.0
/100
|
#328
Tragic
87.6%
Mexican American Indians
0.0
/100
|
#329
Tragic
87.5%
Hondurans
0.0
/100
|
#330
Tragic
87.4%
Hispanics or Latinos
0.0
/100
|
#331
Tragic
87.3%
Immigrants | Azores
0.0
/100
|
#332
Tragic
87.2%
Immigrants | Yemen
0.0
/100
|
#333
Tragic
87.1%
Houma
0.0
/100
|
#334
Tragic
87.0%
Central Americans
0.0
/100
|
#335
Tragic
86.9%
Immigrants | Dominican Republic
0.0
/100
|
#336
Tragic
86.9%
Immigrants | Honduras
0.0
/100
|
#337
Tragic
86.9%
Immigrants | Latin America
0.0
/100
|
#338
Tragic
86.8%
Guatemalans
0.0
/100
|
#339
Tragic
86.4%
Salvadorans
0.0
/100
|
#340
Tragic
86.2%

Demographics Similar to Immigrants from Ireland by 11th Grade

In terms of 11th grade, the demographic groups most similar to Immigrants from Ireland are Greek (94.1%, a difference of 0.010%), Australian (94.1%, a difference of 0.010%), Cypriot (94.1%, a difference of 0.020%), Immigrants from Austria (94.1%, a difference of 0.020%), and Serbian (94.1%, a difference of 0.020%).
DemographicsRating | Rank11th Grade
Northern Europeans
99.9
/100
|
#37
Exceptional
94.2%
Hungarians
99.9
/100
|
#38
Exceptional
94.2%
Immigrants | Lithuania
99.9
/100
|
#39
Exceptional
94.1%
Thais
99.9
/100
|
#40
Exceptional
94.1%
Cypriots
99.9
/100
|
#41
Exceptional
94.1%
Immigrants | Austria
99.9
/100
|
#42
Exceptional
94.1%
Greeks
99.9
/100
|
#43
Exceptional
94.1%
Immigrants | Ireland
99.9
/100
|
#44
Exceptional
94.1%
Australians
99.9
/100
|
#45
Exceptional
94.1%
Serbians
99.9
/100
|
#46
Exceptional
94.1%
Filipinos
99.9
/100
|
#47
Exceptional
94.1%
Macedonians
99.9
/100
|
#48
Exceptional
94.1%
Slavs
99.9
/100
|
#49
Exceptional
94.1%
French
99.9
/100
|
#50
Exceptional
94.1%
Turks
99.9
/100
|
#51
Exceptional
94.0%