Blackfeet vs Immigrants from Ireland 11th Grade
COMPARE
Blackfeet
Immigrants from Ireland
11th Grade
11th Grade Comparison
Blackfeet
Immigrants from Ireland
92.0%
11TH GRADE
10.1/ 100
METRIC RATING
218th/ 347
METRIC RANK
94.1%
11TH GRADE
99.9/ 100
METRIC RATING
44th/ 347
METRIC RANK
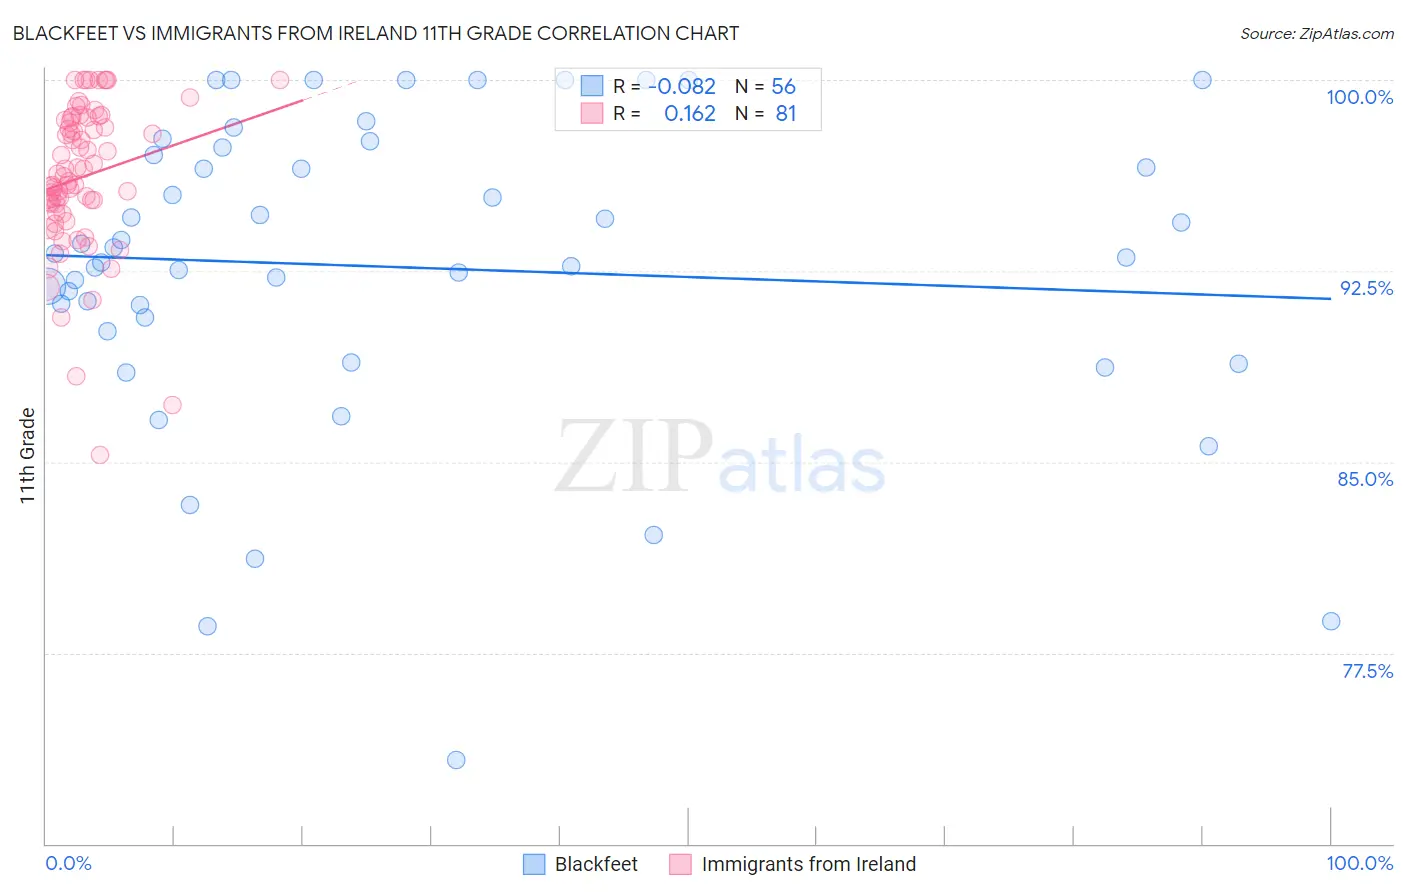
Blackfeet vs Immigrants from Ireland 11th Grade Correlation Chart
The statistical analysis conducted on geographies consisting of 309,582,133 people shows a slight negative correlation between the proportion of Blackfeet and percentage of population with at least 11th grade education in the United States with a correlation coefficient (R) of -0.082 and weighted average of 92.0%. Similarly, the statistical analysis conducted on geographies consisting of 240,784,498 people shows a poor positive correlation between the proportion of Immigrants from Ireland and percentage of population with at least 11th grade education in the United States with a correlation coefficient (R) of 0.162 and weighted average of 94.1%, a difference of 2.3%.
11th Grade Correlation Summary
| Measurement | Blackfeet | Immigrants from Ireland |
| Minimum | 73.3% | 85.3% |
| Maximum | 100.0% | 100.0% |
| Range | 26.7% | 14.7% |
| Mean | 92.7% | 96.2% |
| Median | 93.1% | 96.2% |
| Interquartile 25% (IQ1) | 90.4% | 95.0% |
| Interquartile 75% (IQ3) | 97.2% | 98.5% |
| Interquartile Range (IQR) | 6.8% | 3.5% |
| Standard Deviation (Sample) | 6.1% | 2.9% |
| Standard Deviation (Population) | 6.0% | 2.9% |
Similar Demographics by 11th Grade
Demographics Similar to Blackfeet by 11th Grade
In terms of 11th grade, the demographic groups most similar to Blackfeet are Portuguese (92.0%, a difference of 0.0%), Immigrants from Sierra Leone (92.0%, a difference of 0.030%), Somali (92.1%, a difference of 0.040%), Immigrants from Southern Europe (92.1%, a difference of 0.060%), and Afghan (92.1%, a difference of 0.070%).
| Demographics | Rating | Rank | 11th Grade |
| Immigrants | Micronesia | 17.7 /100 | #211 | Poor 92.2% |
| Koreans | 14.4 /100 | #212 | Poor 92.1% |
| Immigrants | Ethiopia | 13.9 /100 | #213 | Poor 92.1% |
| Afghans | 12.8 /100 | #214 | Poor 92.1% |
| Immigrants | Southern Europe | 12.5 /100 | #215 | Poor 92.1% |
| Somalis | 11.6 /100 | #216 | Poor 92.1% |
| Immigrants | Sierra Leone | 11.1 /100 | #217 | Poor 92.0% |
| Blackfeet | 10.1 /100 | #218 | Poor 92.0% |
| Portuguese | 10.0 /100 | #219 | Tragic 92.0% |
| South American Indians | 7.6 /100 | #220 | Tragic 92.0% |
| Immigrants | Liberia | 7.0 /100 | #221 | Tragic 91.9% |
| Immigrants | Africa | 6.5 /100 | #222 | Tragic 91.9% |
| Immigrants | Bahamas | 6.5 /100 | #223 | Tragic 91.9% |
| Costa Ricans | 6.3 /100 | #224 | Tragic 91.9% |
| Immigrants | Zaire | 5.4 /100 | #225 | Tragic 91.9% |
Demographics Similar to Immigrants from Ireland by 11th Grade
In terms of 11th grade, the demographic groups most similar to Immigrants from Ireland are Greek (94.1%, a difference of 0.010%), Australian (94.1%, a difference of 0.010%), Cypriot (94.1%, a difference of 0.020%), Immigrants from Austria (94.1%, a difference of 0.020%), and Serbian (94.1%, a difference of 0.020%).
| Demographics | Rating | Rank | 11th Grade |
| Northern Europeans | 99.9 /100 | #37 | Exceptional 94.2% |
| Hungarians | 99.9 /100 | #38 | Exceptional 94.2% |
| Immigrants | Lithuania | 99.9 /100 | #39 | Exceptional 94.1% |
| Thais | 99.9 /100 | #40 | Exceptional 94.1% |
| Cypriots | 99.9 /100 | #41 | Exceptional 94.1% |
| Immigrants | Austria | 99.9 /100 | #42 | Exceptional 94.1% |
| Greeks | 99.9 /100 | #43 | Exceptional 94.1% |
| Immigrants | Ireland | 99.9 /100 | #44 | Exceptional 94.1% |
| Australians | 99.9 /100 | #45 | Exceptional 94.1% |
| Serbians | 99.9 /100 | #46 | Exceptional 94.1% |
| Filipinos | 99.9 /100 | #47 | Exceptional 94.1% |
| Macedonians | 99.9 /100 | #48 | Exceptional 94.1% |
| Slavs | 99.9 /100 | #49 | Exceptional 94.1% |
| French | 99.9 /100 | #50 | Exceptional 94.1% |
| Turks | 99.9 /100 | #51 | Exceptional 94.0% |