Immigrants from Yemen vs Comanche 9th Grade
COMPARE
Immigrants from Yemen
Comanche
9th Grade
9th Grade Comparison
Immigrants from Yemen
Comanche
90.8%
9TH GRADE
0.0/ 100
METRIC RATING
333rd/ 347
METRIC RANK
94.6%
9TH GRADE
14.9/ 100
METRIC RATING
209th/ 347
METRIC RANK
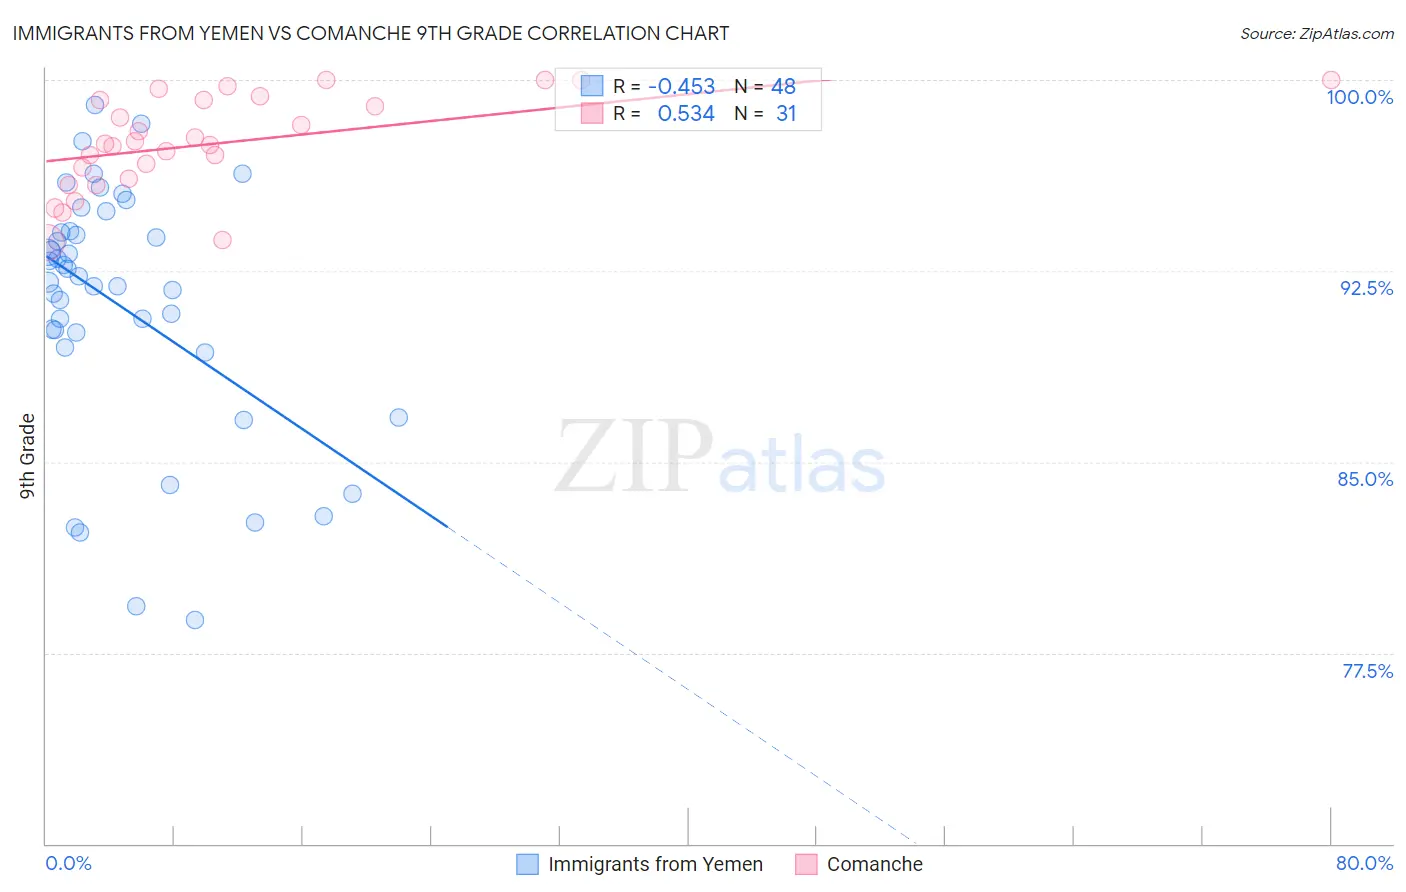
Immigrants from Yemen vs Comanche 9th Grade Correlation Chart
The statistical analysis conducted on geographies consisting of 82,421,120 people shows a moderate negative correlation between the proportion of Immigrants from Yemen and percentage of population with at least 9th grade education in the United States with a correlation coefficient (R) of -0.453 and weighted average of 90.8%. Similarly, the statistical analysis conducted on geographies consisting of 109,786,530 people shows a substantial positive correlation between the proportion of Comanche and percentage of population with at least 9th grade education in the United States with a correlation coefficient (R) of 0.534 and weighted average of 94.6%, a difference of 4.2%.
9th Grade Correlation Summary
| Measurement | Immigrants from Yemen | Comanche |
| Minimum | 78.8% | 93.6% |
| Maximum | 99.0% | 100.0% |
| Range | 20.2% | 6.4% |
| Mean | 91.1% | 97.5% |
| Median | 92.2% | 97.5% |
| Interquartile 25% (IQ1) | 89.8% | 96.1% |
| Interquartile 75% (IQ3) | 94.0% | 99.2% |
| Interquartile Range (IQR) | 4.3% | 3.1% |
| Standard Deviation (Sample) | 4.9% | 1.9% |
| Standard Deviation (Population) | 4.8% | 1.8% |
Similar Demographics by 9th Grade
Demographics Similar to Immigrants from Yemen by 9th Grade
In terms of 9th grade, the demographic groups most similar to Immigrants from Yemen are Immigrants from the Azores (90.8%, a difference of 0.050%), Hispanic or Latino (90.9%, a difference of 0.090%), Mexican American Indian (90.9%, a difference of 0.11%), Immigrants from Cabo Verde (90.9%, a difference of 0.14%), and Immigrants from Honduras (90.6%, a difference of 0.22%).
| Demographics | Rating | Rank | 9th Grade |
| Immigrants | Armenia | 0.0 /100 | #326 | Tragic 91.4% |
| Immigrants | Nicaragua | 0.0 /100 | #327 | Tragic 91.3% |
| Dominicans | 0.0 /100 | #328 | Tragic 91.1% |
| Hondurans | 0.0 /100 | #329 | Tragic 91.0% |
| Immigrants | Cabo Verde | 0.0 /100 | #330 | Tragic 90.9% |
| Mexican American Indians | 0.0 /100 | #331 | Tragic 90.9% |
| Hispanics or Latinos | 0.0 /100 | #332 | Tragic 90.9% |
| Immigrants | Yemen | 0.0 /100 | #333 | Tragic 90.8% |
| Immigrants | Azores | 0.0 /100 | #334 | Tragic 90.8% |
| Immigrants | Honduras | 0.0 /100 | #335 | Tragic 90.6% |
| Immigrants | Dominican Republic | 0.0 /100 | #336 | Tragic 90.5% |
| Immigrants | Latin America | 0.0 /100 | #337 | Tragic 90.4% |
| Central Americans | 0.0 /100 | #338 | Tragic 90.4% |
| Yakama | 0.0 /100 | #339 | Tragic 90.1% |
| Mexicans | 0.0 /100 | #340 | Tragic 90.0% |
Demographics Similar to Comanche by 9th Grade
In terms of 9th grade, the demographic groups most similar to Comanche are Immigrants from Pakistan (94.6%, a difference of 0.010%), Immigrants from Morocco (94.6%, a difference of 0.020%), Immigrants from Chile (94.5%, a difference of 0.020%), Samoan (94.6%, a difference of 0.030%), and Immigrants from Sudan (94.6%, a difference of 0.040%).
| Demographics | Rating | Rank | 9th Grade |
| Immigrants | Eastern Asia | 19.8 /100 | #202 | Poor 94.6% |
| Immigrants | Bahamas | 19.8 /100 | #203 | Poor 94.6% |
| Moroccans | 19.6 /100 | #204 | Poor 94.6% |
| Immigrants | Sudan | 17.6 /100 | #205 | Poor 94.6% |
| Samoans | 17.3 /100 | #206 | Poor 94.6% |
| Immigrants | Morocco | 16.3 /100 | #207 | Poor 94.6% |
| Immigrants | Pakistan | 15.5 /100 | #208 | Poor 94.6% |
| Comanche | 14.9 /100 | #209 | Poor 94.6% |
| Immigrants | Chile | 13.4 /100 | #210 | Poor 94.5% |
| Immigrants | Indonesia | 12.3 /100 | #211 | Poor 94.5% |
| Immigrants | Malaysia | 12.2 /100 | #212 | Poor 94.5% |
| Immigrants | Oceania | 12.1 /100 | #213 | Poor 94.5% |
| Immigrants | Liberia | 11.8 /100 | #214 | Poor 94.5% |
| Immigrants | Syria | 11.0 /100 | #215 | Poor 94.5% |
| Immigrants | Western Asia | 10.7 /100 | #216 | Poor 94.5% |