Immigrants from Western Europe vs Ethiopian Bachelor's Degree
COMPARE
Immigrants from Western Europe
Ethiopian
Bachelor's Degree
Bachelor's Degree Comparison
Immigrants from Western Europe
Ethiopians
42.0%
BACHELOR'S DEGREE
99.0/ 100
METRIC RATING
88th/ 347
METRIC RANK
42.8%
BACHELOR'S DEGREE
99.5/ 100
METRIC RATING
72nd/ 347
METRIC RANK
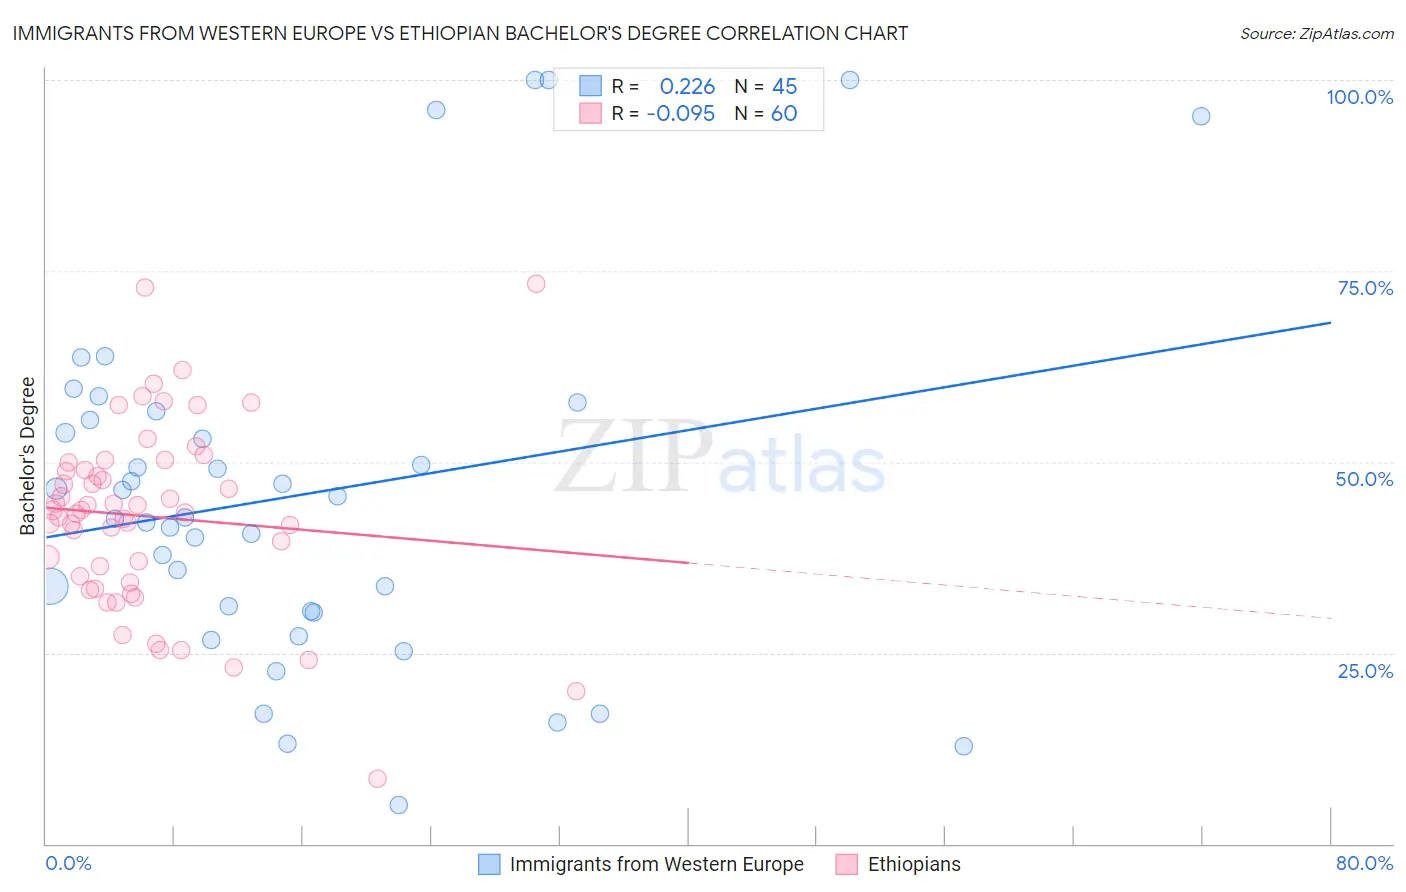
Immigrants from Western Europe vs Ethiopian Bachelor's Degree Correlation Chart
The statistical analysis conducted on geographies consisting of 494,046,923 people shows a weak positive correlation between the proportion of Immigrants from Western Europe and percentage of population with at least bachelor's degree education in the United States with a correlation coefficient (R) of 0.226 and weighted average of 42.0%. Similarly, the statistical analysis conducted on geographies consisting of 223,255,026 people shows a slight negative correlation between the proportion of Ethiopians and percentage of population with at least bachelor's degree education in the United States with a correlation coefficient (R) of -0.095 and weighted average of 42.8%, a difference of 1.8%.
Bachelor's Degree Correlation Summary
| Measurement | Immigrants from Western Europe | Ethiopian |
| Minimum | 5.1% | 8.5% |
| Maximum | 100.0% | 73.3% |
| Range | 94.9% | 64.9% |
| Mean | 45.8% | 42.8% |
| Median | 42.7% | 43.5% |
| Interquartile 25% (IQ1) | 30.4% | 34.6% |
| Interquartile 75% (IQ3) | 56.1% | 49.4% |
| Interquartile Range (IQR) | 25.7% | 14.8% |
| Standard Deviation (Sample) | 23.7% | 12.2% |
| Standard Deviation (Population) | 23.4% | 12.1% |
Demographics Similar to Immigrants from Western Europe and Ethiopians by Bachelor's Degree
In terms of bachelor's degree, the demographic groups most similar to Immigrants from Western Europe are Greek (42.0%, a difference of 0.0%), Carpatho Rusyn (42.1%, a difference of 0.12%), Laotian (42.0%, a difference of 0.13%), Immigrants from Brazil (42.2%, a difference of 0.43%), and Lithuanian (42.2%, a difference of 0.51%). Similarly, the demographic groups most similar to Ethiopians are Immigrants from Uzbekistan (42.8%, a difference of 0.050%), Immigrants from Argentina (42.8%, a difference of 0.090%), Bhutanese (42.7%, a difference of 0.27%), Immigrants from Romania (42.9%, a difference of 0.35%), and Immigrants from Zimbabwe (42.6%, a difference of 0.48%).
| Demographics | Rating | Rank | Bachelor's Degree |
| Immigrants | Romania | 99.6 /100 | #70 | Exceptional 42.9% |
| Immigrants | Argentina | 99.6 /100 | #71 | Exceptional 42.8% |
| Ethiopians | 99.5 /100 | #72 | Exceptional 42.8% |
| Immigrants | Uzbekistan | 99.5 /100 | #73 | Exceptional 42.8% |
| Bhutanese | 99.5 /100 | #74 | Exceptional 42.7% |
| Immigrants | Zimbabwe | 99.4 /100 | #75 | Exceptional 42.6% |
| Immigrants | Egypt | 99.4 /100 | #76 | Exceptional 42.6% |
| Immigrants | Eastern Europe | 99.4 /100 | #77 | Exceptional 42.5% |
| Immigrants | Ethiopia | 99.4 /100 | #78 | Exceptional 42.5% |
| Immigrants | Lebanon | 99.3 /100 | #79 | Exceptional 42.4% |
| Immigrants | Croatia | 99.2 /100 | #80 | Exceptional 42.3% |
| Immigrants | Hungary | 99.2 /100 | #81 | Exceptional 42.3% |
| Immigrants | Scotland | 99.2 /100 | #82 | Exceptional 42.3% |
| Armenians | 99.2 /100 | #83 | Exceptional 42.3% |
| Immigrants | Western Asia | 99.2 /100 | #84 | Exceptional 42.3% |
| Lithuanians | 99.2 /100 | #85 | Exceptional 42.2% |
| Immigrants | Brazil | 99.2 /100 | #86 | Exceptional 42.2% |
| Carpatho Rusyns | 99.0 /100 | #87 | Exceptional 42.1% |
| Immigrants | Western Europe | 99.0 /100 | #88 | Exceptional 42.0% |
| Greeks | 99.0 /100 | #89 | Exceptional 42.0% |
| Laotians | 98.9 /100 | #90 | Exceptional 42.0% |