Immigrants from Western Europe vs Albanian Bachelor's Degree
COMPARE
Immigrants from Western Europe
Albanian
Bachelor's Degree
Bachelor's Degree Comparison
Immigrants from Western Europe
Albanians
42.0%
BACHELOR'S DEGREE
99.0/ 100
METRIC RATING
88th/ 347
METRIC RANK
40.9%
BACHELOR'S DEGREE
96.5/ 100
METRIC RATING
110th/ 347
METRIC RANK
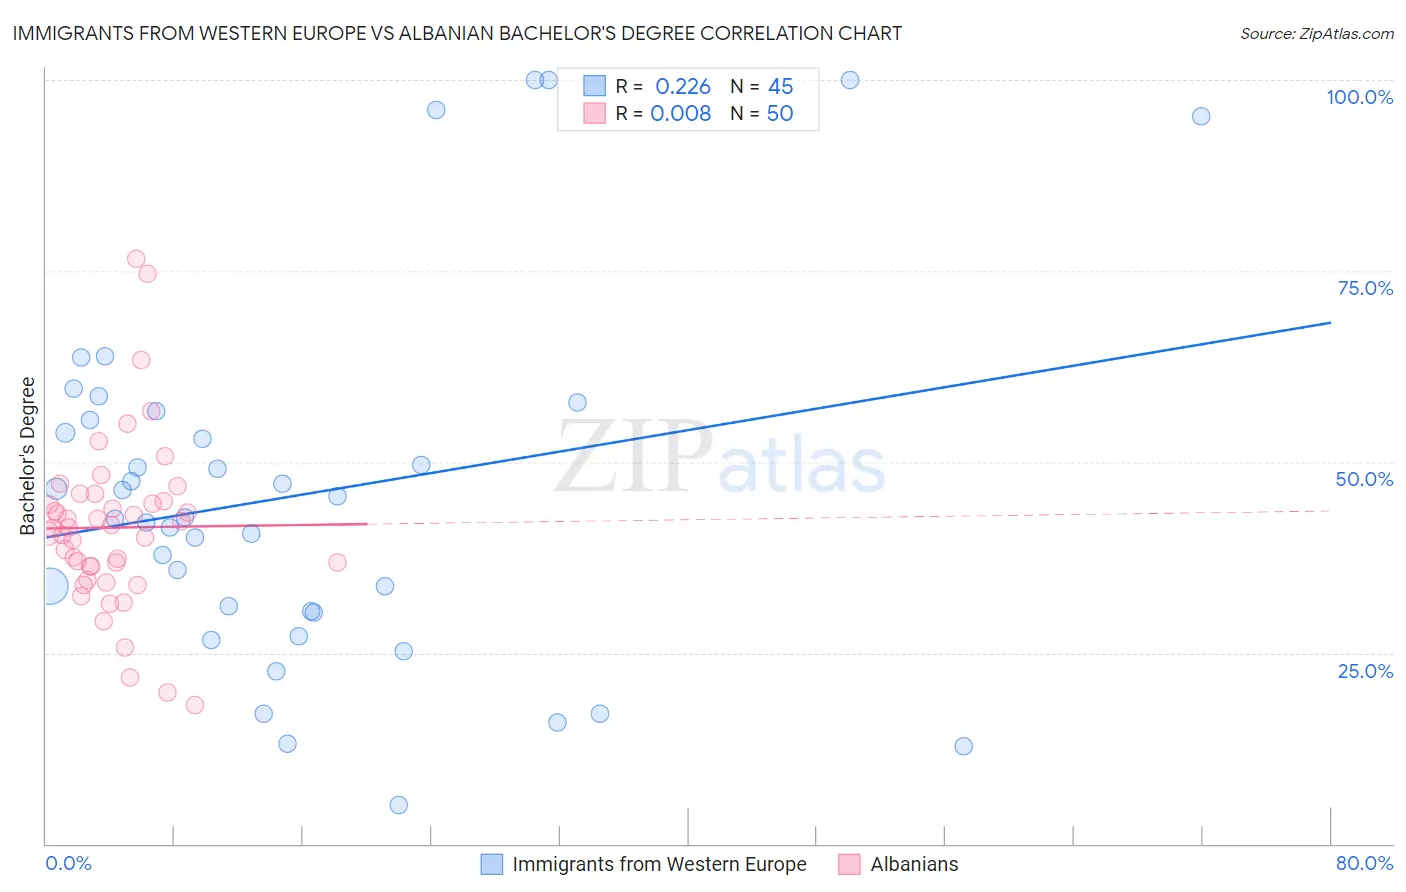
Immigrants from Western Europe vs Albanian Bachelor's Degree Correlation Chart
The statistical analysis conducted on geographies consisting of 494,046,923 people shows a weak positive correlation between the proportion of Immigrants from Western Europe and percentage of population with at least bachelor's degree education in the United States with a correlation coefficient (R) of 0.226 and weighted average of 42.0%. Similarly, the statistical analysis conducted on geographies consisting of 193,245,507 people shows no correlation between the proportion of Albanians and percentage of population with at least bachelor's degree education in the United States with a correlation coefficient (R) of 0.008 and weighted average of 40.9%, a difference of 2.9%.
Bachelor's Degree Correlation Summary
| Measurement | Immigrants from Western Europe | Albanian |
| Minimum | 5.1% | 18.2% |
| Maximum | 100.0% | 76.7% |
| Range | 94.9% | 58.4% |
| Mean | 45.8% | 41.4% |
| Median | 42.7% | 41.4% |
| Interquartile 25% (IQ1) | 30.4% | 36.3% |
| Interquartile 75% (IQ3) | 56.1% | 44.8% |
| Interquartile Range (IQR) | 25.7% | 8.5% |
| Standard Deviation (Sample) | 23.7% | 11.2% |
| Standard Deviation (Population) | 23.4% | 11.1% |
Similar Demographics by Bachelor's Degree
Demographics Similar to Immigrants from Western Europe by Bachelor's Degree
In terms of bachelor's degree, the demographic groups most similar to Immigrants from Western Europe are Greek (42.0%, a difference of 0.0%), Carpatho Rusyn (42.1%, a difference of 0.12%), Laotian (42.0%, a difference of 0.13%), Immigrants from Northern Africa (41.9%, a difference of 0.23%), and Maltese (41.9%, a difference of 0.30%).
| Demographics | Rating | Rank | Bachelor's Degree |
| Immigrants | Hungary | 99.2 /100 | #81 | Exceptional 42.3% |
| Immigrants | Scotland | 99.2 /100 | #82 | Exceptional 42.3% |
| Armenians | 99.2 /100 | #83 | Exceptional 42.3% |
| Immigrants | Western Asia | 99.2 /100 | #84 | Exceptional 42.3% |
| Lithuanians | 99.2 /100 | #85 | Exceptional 42.2% |
| Immigrants | Brazil | 99.2 /100 | #86 | Exceptional 42.2% |
| Carpatho Rusyns | 99.0 /100 | #87 | Exceptional 42.1% |
| Immigrants | Western Europe | 99.0 /100 | #88 | Exceptional 42.0% |
| Greeks | 99.0 /100 | #89 | Exceptional 42.0% |
| Laotians | 98.9 /100 | #90 | Exceptional 42.0% |
| Immigrants | Northern Africa | 98.9 /100 | #91 | Exceptional 41.9% |
| Maltese | 98.8 /100 | #92 | Exceptional 41.9% |
| Immigrants | Canada | 98.6 /100 | #93 | Exceptional 41.7% |
| Immigrants | Nepal | 98.6 /100 | #94 | Exceptional 41.7% |
| Immigrants | North America | 98.5 /100 | #95 | Exceptional 41.7% |
Demographics Similar to Albanians by Bachelor's Degree
In terms of bachelor's degree, the demographic groups most similar to Albanians are Immigrants from Chile (40.8%, a difference of 0.050%), Arab (40.9%, a difference of 0.080%), Ukrainian (40.9%, a difference of 0.090%), Ugandan (40.8%, a difference of 0.090%), and Brazilian (40.8%, a difference of 0.14%).
| Demographics | Rating | Rank | Bachelor's Degree |
| Chileans | 97.5 /100 | #103 | Exceptional 41.2% |
| Jordanians | 97.4 /100 | #104 | Exceptional 41.2% |
| Syrians | 97.4 /100 | #105 | Exceptional 41.1% |
| Alsatians | 97.0 /100 | #106 | Exceptional 41.0% |
| Northern Europeans | 96.8 /100 | #107 | Exceptional 41.0% |
| Ukrainians | 96.6 /100 | #108 | Exceptional 40.9% |
| Arabs | 96.6 /100 | #109 | Exceptional 40.9% |
| Albanians | 96.5 /100 | #110 | Exceptional 40.9% |
| Immigrants | Chile | 96.4 /100 | #111 | Exceptional 40.8% |
| Ugandans | 96.3 /100 | #112 | Exceptional 40.8% |
| Brazilians | 96.3 /100 | #113 | Exceptional 40.8% |
| Afghans | 96.2 /100 | #114 | Exceptional 40.8% |
| Palestinians | 95.8 /100 | #115 | Exceptional 40.7% |
| Immigrants | Uganda | 95.7 /100 | #116 | Exceptional 40.7% |
| Austrians | 95.5 /100 | #117 | Exceptional 40.6% |