Immigrants from Western Asia vs European 12th Grade, No Diploma
COMPARE
Immigrants from Western Asia
European
12th Grade, No Diploma
12th Grade, No Diploma Comparison
Immigrants from Western Asia
Europeans
91.2%
12TH GRADE, NO DIPLOMA
49.0/ 100
METRIC RATING
175th/ 347
METRIC RANK
93.1%
12TH GRADE, NO DIPLOMA
99.9/ 100
METRIC RATING
32nd/ 347
METRIC RANK
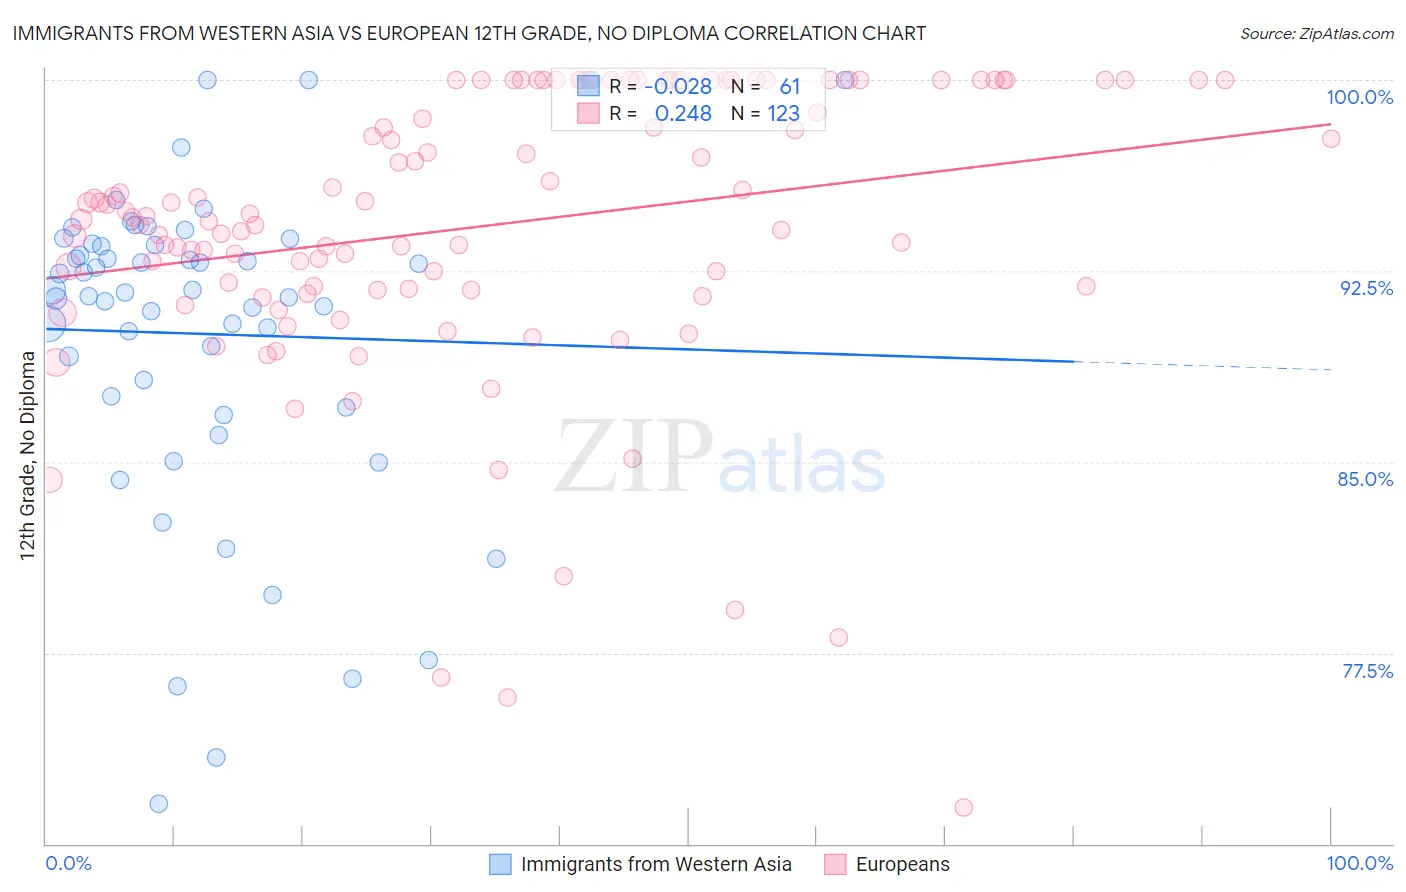
Immigrants from Western Asia vs European 12th Grade, No Diploma Correlation Chart
The statistical analysis conducted on geographies consisting of 404,433,811 people shows no correlation between the proportion of Immigrants from Western Asia and percentage of population with at least 12th grade (no diploma) education in the United States with a correlation coefficient (R) of -0.028 and weighted average of 91.2%. Similarly, the statistical analysis conducted on geographies consisting of 561,829,322 people shows a weak positive correlation between the proportion of Europeans and percentage of population with at least 12th grade (no diploma) education in the United States with a correlation coefficient (R) of 0.248 and weighted average of 93.1%, a difference of 2.1%.
12th Grade, No Diploma Correlation Summary
| Measurement | Immigrants from Western Asia | European |
| Minimum | 71.6% | 71.4% |
| Maximum | 100.0% | 100.0% |
| Range | 28.4% | 28.6% |
| Mean | 90.0% | 94.3% |
| Median | 91.6% | 94.6% |
| Interquartile 25% (IQ1) | 87.4% | 91.8% |
| Interquartile 75% (IQ3) | 93.5% | 100.0% |
| Interquartile Range (IQR) | 6.2% | 8.2% |
| Standard Deviation (Sample) | 6.3% | 5.7% |
| Standard Deviation (Population) | 6.2% | 5.6% |
Similar Demographics by 12th Grade, No Diploma
Demographics Similar to Immigrants from Western Asia by 12th Grade, No Diploma
In terms of 12th grade, no diploma, the demographic groups most similar to Immigrants from Western Asia are Immigrants from Nepal (91.2%, a difference of 0.010%), Iroquois (91.1%, a difference of 0.010%), Bermudan (91.2%, a difference of 0.020%), Bolivian (91.2%, a difference of 0.020%), and Sierra Leonean (91.1%, a difference of 0.020%).
| Demographics | Rating | Rank | 12th Grade, No Diploma |
| Cree | 57.0 /100 | #168 | Average 91.2% |
| Immigrants | Indonesia | 54.9 /100 | #169 | Average 91.2% |
| Delaware | 52.8 /100 | #170 | Average 91.2% |
| Immigrants | Morocco | 51.4 /100 | #171 | Average 91.2% |
| Bermudans | 50.8 /100 | #172 | Average 91.2% |
| Bolivians | 50.4 /100 | #173 | Average 91.2% |
| Immigrants | Nepal | 50.0 /100 | #174 | Average 91.2% |
| Immigrants | Western Asia | 49.0 /100 | #175 | Average 91.2% |
| Iroquois | 48.5 /100 | #176 | Average 91.1% |
| Sierra Leoneans | 47.7 /100 | #177 | Average 91.1% |
| Spanish | 43.7 /100 | #178 | Average 91.1% |
| Immigrants | Chile | 43.3 /100 | #179 | Average 91.1% |
| Immigrants | Syria | 40.3 /100 | #180 | Average 91.1% |
| Guamanians/Chamorros | 39.5 /100 | #181 | Fair 91.0% |
| Immigrants | Nonimmigrants | 38.8 /100 | #182 | Fair 91.0% |
Demographics Similar to Europeans by 12th Grade, No Diploma
In terms of 12th grade, no diploma, the demographic groups most similar to Europeans are Immigrants from Ireland (93.1%, a difference of 0.010%), Iranian (93.1%, a difference of 0.030%), Immigrants from Lithuania (93.1%, a difference of 0.030%), Immigrants from Scotland (93.0%, a difference of 0.030%), and Immigrants from Northern Europe (93.1%, a difference of 0.040%).
| Demographics | Rating | Rank | 12th Grade, No Diploma |
| Czechs | 99.9 /100 | #25 | Exceptional 93.2% |
| Russians | 99.9 /100 | #26 | Exceptional 93.2% |
| Cypriots | 99.9 /100 | #27 | Exceptional 93.1% |
| Immigrants | Northern Europe | 99.9 /100 | #28 | Exceptional 93.1% |
| Iranians | 99.9 /100 | #29 | Exceptional 93.1% |
| Immigrants | Lithuania | 99.9 /100 | #30 | Exceptional 93.1% |
| Immigrants | Ireland | 99.9 /100 | #31 | Exceptional 93.1% |
| Europeans | 99.9 /100 | #32 | Exceptional 93.1% |
| Immigrants | Scotland | 99.9 /100 | #33 | Exceptional 93.0% |
| Okinawans | 99.9 /100 | #34 | Exceptional 93.0% |
| English | 99.9 /100 | #35 | Exceptional 93.0% |
| Scottish | 99.9 /100 | #36 | Exceptional 93.0% |
| Irish | 99.9 /100 | #37 | Exceptional 93.0% |
| Tlingit-Haida | 99.8 /100 | #38 | Exceptional 93.0% |
| Immigrants | Austria | 99.8 /100 | #39 | Exceptional 93.0% |