Immigrants from Western Africa vs Greek Professional Degree
COMPARE
Immigrants from Western Africa
Greek
Professional Degree
Professional Degree Comparison
Immigrants from Western Africa
Greeks
4.0%
PROFESSIONAL DEGREE
7.5/ 100
METRIC RATING
222nd/ 347
METRIC RANK
5.3%
PROFESSIONAL DEGREE
99.6/ 100
METRIC RATING
86th/ 347
METRIC RANK
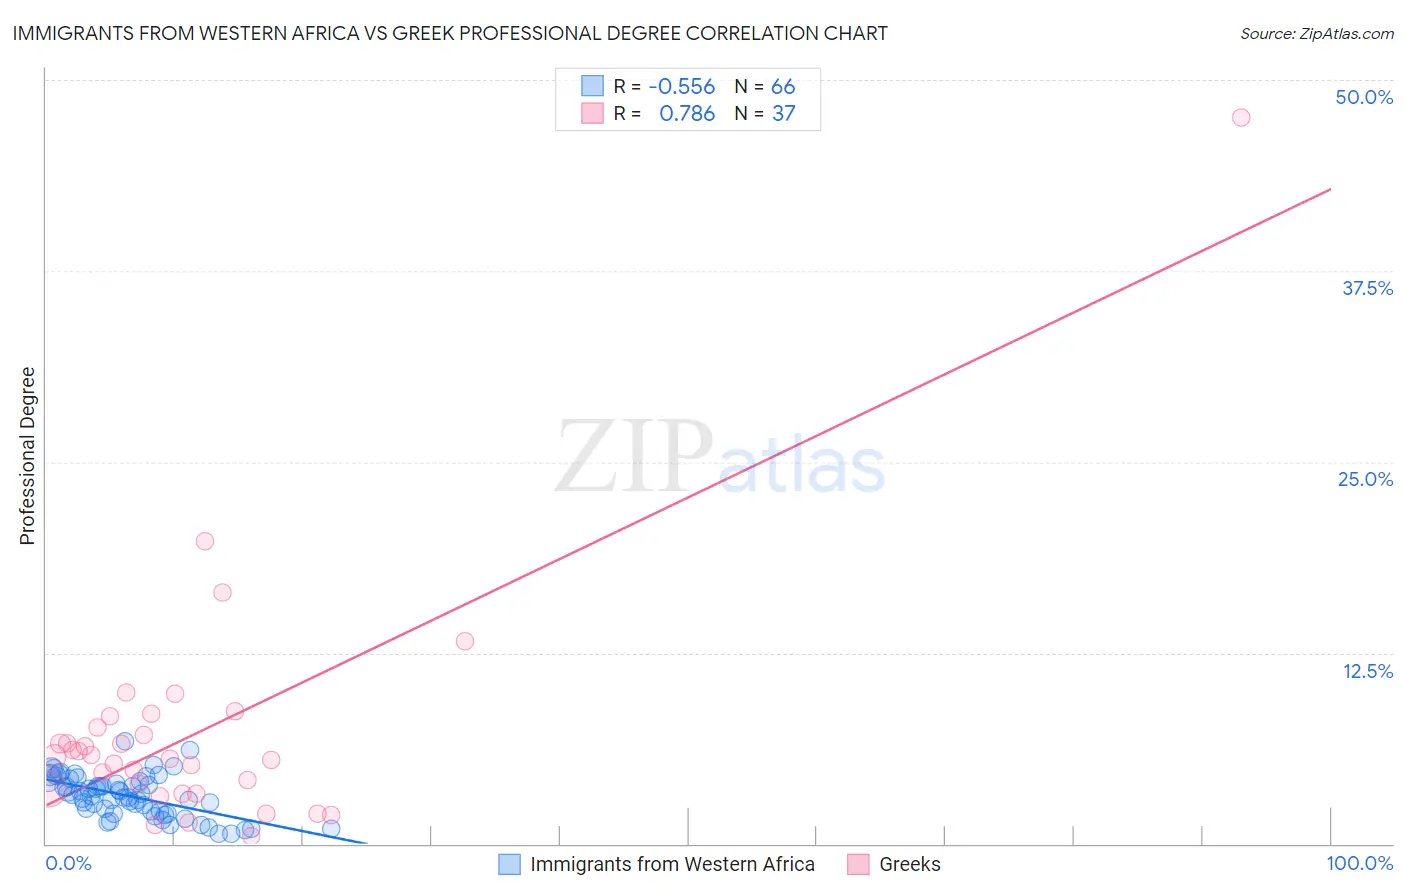
Immigrants from Western Africa vs Greek Professional Degree Correlation Chart
The statistical analysis conducted on geographies consisting of 357,190,619 people shows a substantial negative correlation between the proportion of Immigrants from Western Africa and percentage of population with at least professional degree education in the United States with a correlation coefficient (R) of -0.556 and weighted average of 4.0%. Similarly, the statistical analysis conducted on geographies consisting of 480,768,816 people shows a strong positive correlation between the proportion of Greeks and percentage of population with at least professional degree education in the United States with a correlation coefficient (R) of 0.786 and weighted average of 5.3%, a difference of 31.6%.
Professional Degree Correlation Summary
| Measurement | Immigrants from Western Africa | Greek |
| Minimum | 0.64% | 0.52% |
| Maximum | 6.7% | 47.6% |
| Range | 6.1% | 47.0% |
| Mean | 3.1% | 7.2% |
| Median | 3.1% | 5.7% |
| Interquartile 25% (IQ1) | 2.2% | 3.4% |
| Interquartile 75% (IQ3) | 4.1% | 8.0% |
| Interquartile Range (IQR) | 2.0% | 4.6% |
| Standard Deviation (Sample) | 1.4% | 7.9% |
| Standard Deviation (Population) | 1.3% | 7.8% |
Similar Demographics by Professional Degree
Demographics Similar to Immigrants from Western Africa by Professional Degree
In terms of professional degree, the demographic groups most similar to Immigrants from Western Africa are Immigrants from Bosnia and Herzegovina (4.0%, a difference of 0.080%), Trinidadian and Tobagonian (4.0%, a difference of 0.22%), French Canadian (4.0%, a difference of 0.25%), Tlingit-Haida (4.0%, a difference of 0.35%), and Ute (4.0%, a difference of 0.38%).
| Demographics | Rating | Rank | Professional Degree |
| Portuguese | 10.5 /100 | #215 | Poor 4.1% |
| West Indians | 9.8 /100 | #216 | Tragic 4.1% |
| Immigrants | Vietnam | 9.4 /100 | #217 | Tragic 4.0% |
| Dutch | 9.0 /100 | #218 | Tragic 4.0% |
| Immigrants | South Eastern Asia | 8.9 /100 | #219 | Tragic 4.0% |
| Ute | 8.2 /100 | #220 | Tragic 4.0% |
| French Canadians | 8.0 /100 | #221 | Tragic 4.0% |
| Immigrants | Western Africa | 7.5 /100 | #222 | Tragic 4.0% |
| Immigrants | Bosnia and Herzegovina | 7.4 /100 | #223 | Tragic 4.0% |
| Trinidadians and Tobagonians | 7.1 /100 | #224 | Tragic 4.0% |
| Tlingit-Haida | 6.9 /100 | #225 | Tragic 4.0% |
| German Russians | 6.1 /100 | #226 | Tragic 4.0% |
| Cubans | 5.9 /100 | #227 | Tragic 4.0% |
| Immigrants | West Indies | 5.6 /100 | #228 | Tragic 4.0% |
| Immigrants | Burma/Myanmar | 5.4 /100 | #229 | Tragic 3.9% |
Demographics Similar to Greeks by Professional Degree
In terms of professional degree, the demographic groups most similar to Greeks are Immigrants from Zimbabwe (5.3%, a difference of 0.0%), Carpatho Rusyn (5.3%, a difference of 0.020%), Immigrants from Croatia (5.3%, a difference of 0.020%), Immigrants from Chile (5.3%, a difference of 0.11%), and Romanian (5.3%, a difference of 0.23%).
| Demographics | Rating | Rank | Professional Degree |
| Immigrants | North America | 99.7 /100 | #79 | Exceptional 5.3% |
| Immigrants | England | 99.6 /100 | #80 | Exceptional 5.3% |
| Immigrants | Brazil | 99.6 /100 | #81 | Exceptional 5.3% |
| Romanians | 99.6 /100 | #82 | Exceptional 5.3% |
| Carpatho Rusyns | 99.6 /100 | #83 | Exceptional 5.3% |
| Immigrants | Croatia | 99.6 /100 | #84 | Exceptional 5.3% |
| Immigrants | Zimbabwe | 99.6 /100 | #85 | Exceptional 5.3% |
| Greeks | 99.6 /100 | #86 | Exceptional 5.3% |
| Immigrants | Chile | 99.5 /100 | #87 | Exceptional 5.3% |
| Egyptians | 99.5 /100 | #88 | Exceptional 5.3% |
| Chileans | 99.5 /100 | #89 | Exceptional 5.3% |
| Immigrants | Scotland | 99.5 /100 | #90 | Exceptional 5.3% |
| Laotians | 99.5 /100 | #91 | Exceptional 5.2% |
| Immigrants | Eastern Europe | 99.5 /100 | #92 | Exceptional 5.2% |
| Northern Europeans | 99.3 /100 | #93 | Exceptional 5.2% |