Costa Rican vs Greek Professional Degree
COMPARE
Costa Rican
Greek
Professional Degree
Professional Degree Comparison
Costa Ricans
Greeks
4.5%
PROFESSIONAL DEGREE
59.9/ 100
METRIC RATING
165th/ 347
METRIC RANK
5.3%
PROFESSIONAL DEGREE
99.6/ 100
METRIC RATING
86th/ 347
METRIC RANK
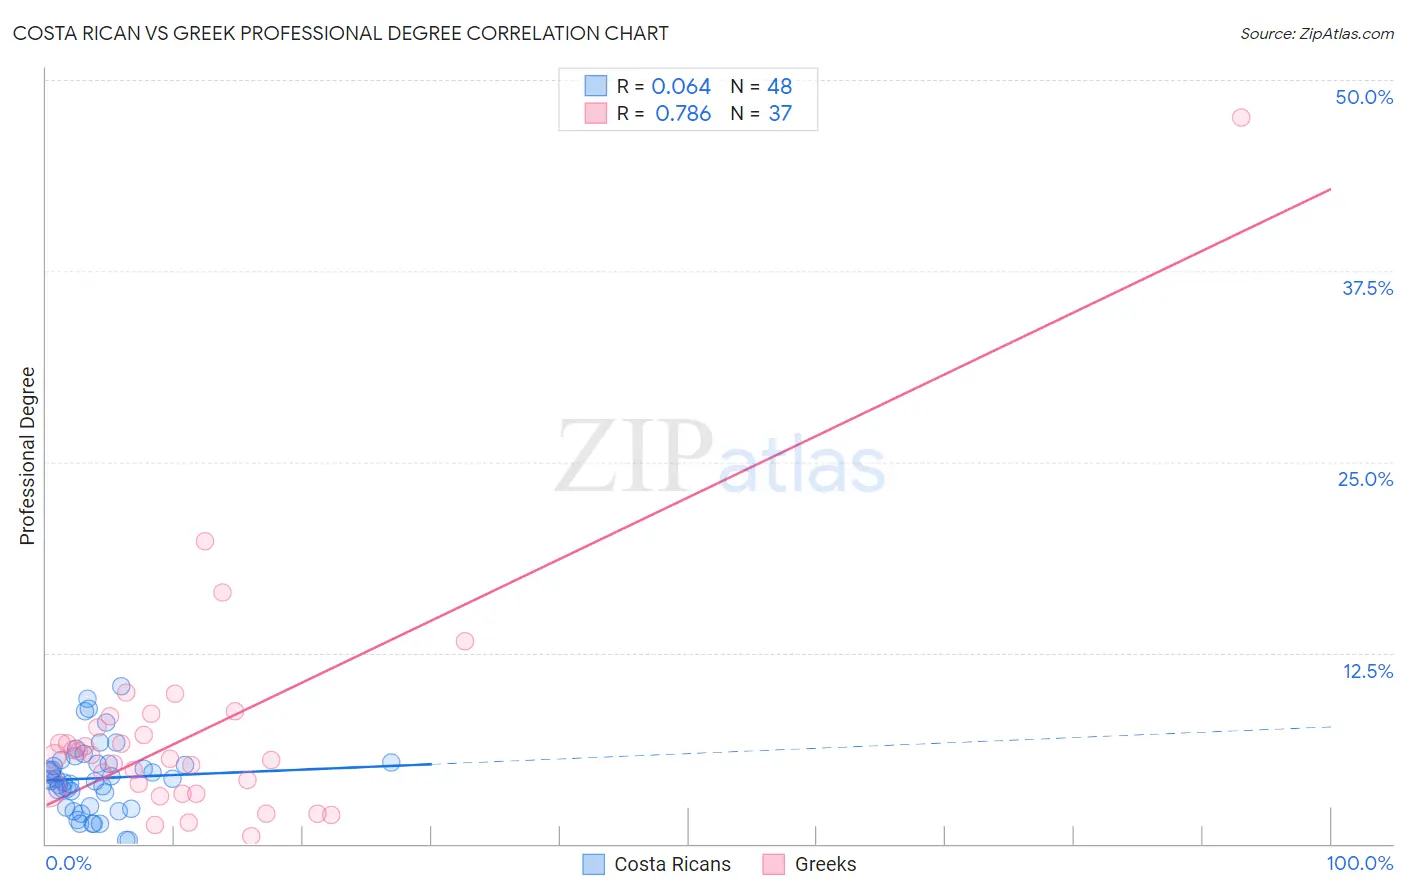
Costa Rican vs Greek Professional Degree Correlation Chart
The statistical analysis conducted on geographies consisting of 253,366,674 people shows a slight positive correlation between the proportion of Costa Ricans and percentage of population with at least professional degree education in the United States with a correlation coefficient (R) of 0.064 and weighted average of 4.5%. Similarly, the statistical analysis conducted on geographies consisting of 480,768,816 people shows a strong positive correlation between the proportion of Greeks and percentage of population with at least professional degree education in the United States with a correlation coefficient (R) of 0.786 and weighted average of 5.3%, a difference of 17.9%.
Professional Degree Correlation Summary
| Measurement | Costa Rican | Greek |
| Minimum | 0.25% | 0.52% |
| Maximum | 10.3% | 47.6% |
| Range | 10.0% | 47.0% |
| Mean | 4.3% | 7.2% |
| Median | 4.2% | 5.7% |
| Interquartile 25% (IQ1) | 2.4% | 3.4% |
| Interquartile 75% (IQ3) | 5.3% | 8.0% |
| Interquartile Range (IQR) | 2.9% | 4.6% |
| Standard Deviation (Sample) | 2.3% | 7.9% |
| Standard Deviation (Population) | 2.3% | 7.8% |
Similar Demographics by Professional Degree
Demographics Similar to Costa Ricans by Professional Degree
In terms of professional degree, the demographic groups most similar to Costa Ricans are Immigrants from Colombia (4.5%, a difference of 0.080%), Immigrants from Afghanistan (4.5%, a difference of 0.11%), Swiss (4.5%, a difference of 0.17%), Immigrants from Sierra Leone (4.5%, a difference of 0.17%), and Chinese (4.5%, a difference of 0.19%).
| Demographics | Rating | Rank | Professional Degree |
| Immigrants | Armenia | 68.8 /100 | #158 | Good 4.5% |
| Vietnamese | 68.4 /100 | #159 | Good 4.5% |
| Immigrants | Senegal | 68.0 /100 | #160 | Good 4.5% |
| Assyrians/Chaldeans/Syriacs | 67.4 /100 | #161 | Good 4.5% |
| Peruvians | 65.2 /100 | #162 | Good 4.5% |
| Sierra Leoneans | 64.3 /100 | #163 | Good 4.5% |
| Swiss | 61.0 /100 | #164 | Good 4.5% |
| Costa Ricans | 59.9 /100 | #165 | Average 4.5% |
| Immigrants | Colombia | 59.4 /100 | #166 | Average 4.5% |
| Immigrants | Afghanistan | 59.2 /100 | #167 | Average 4.5% |
| Immigrants | Sierra Leone | 58.7 /100 | #168 | Average 4.5% |
| Chinese | 58.6 /100 | #169 | Average 4.5% |
| Immigrants | Zaire | 57.4 /100 | #170 | Average 4.5% |
| Immigrants | Bangladesh | 56.0 /100 | #171 | Average 4.4% |
| Spaniards | 52.0 /100 | #172 | Average 4.4% |
Demographics Similar to Greeks by Professional Degree
In terms of professional degree, the demographic groups most similar to Greeks are Immigrants from Zimbabwe (5.3%, a difference of 0.0%), Carpatho Rusyn (5.3%, a difference of 0.020%), Immigrants from Croatia (5.3%, a difference of 0.020%), Immigrants from Chile (5.3%, a difference of 0.11%), and Romanian (5.3%, a difference of 0.23%).
| Demographics | Rating | Rank | Professional Degree |
| Immigrants | North America | 99.7 /100 | #79 | Exceptional 5.3% |
| Immigrants | England | 99.6 /100 | #80 | Exceptional 5.3% |
| Immigrants | Brazil | 99.6 /100 | #81 | Exceptional 5.3% |
| Romanians | 99.6 /100 | #82 | Exceptional 5.3% |
| Carpatho Rusyns | 99.6 /100 | #83 | Exceptional 5.3% |
| Immigrants | Croatia | 99.6 /100 | #84 | Exceptional 5.3% |
| Immigrants | Zimbabwe | 99.6 /100 | #85 | Exceptional 5.3% |
| Greeks | 99.6 /100 | #86 | Exceptional 5.3% |
| Immigrants | Chile | 99.5 /100 | #87 | Exceptional 5.3% |
| Egyptians | 99.5 /100 | #88 | Exceptional 5.3% |
| Chileans | 99.5 /100 | #89 | Exceptional 5.3% |
| Immigrants | Scotland | 99.5 /100 | #90 | Exceptional 5.3% |
| Laotians | 99.5 /100 | #91 | Exceptional 5.2% |
| Immigrants | Eastern Europe | 99.5 /100 | #92 | Exceptional 5.2% |
| Northern Europeans | 99.3 /100 | #93 | Exceptional 5.2% |