Immigrants from Vietnam vs German Russian 8th Grade
COMPARE
Immigrants from Vietnam
German Russian
8th Grade
8th Grade Comparison
Immigrants from Vietnam
German Russians
93.5%
8TH GRADE
0.0/ 100
METRIC RATING
314th/ 347
METRIC RANK
96.4%
8TH GRADE
98.8/ 100
METRIC RATING
95th/ 347
METRIC RANK
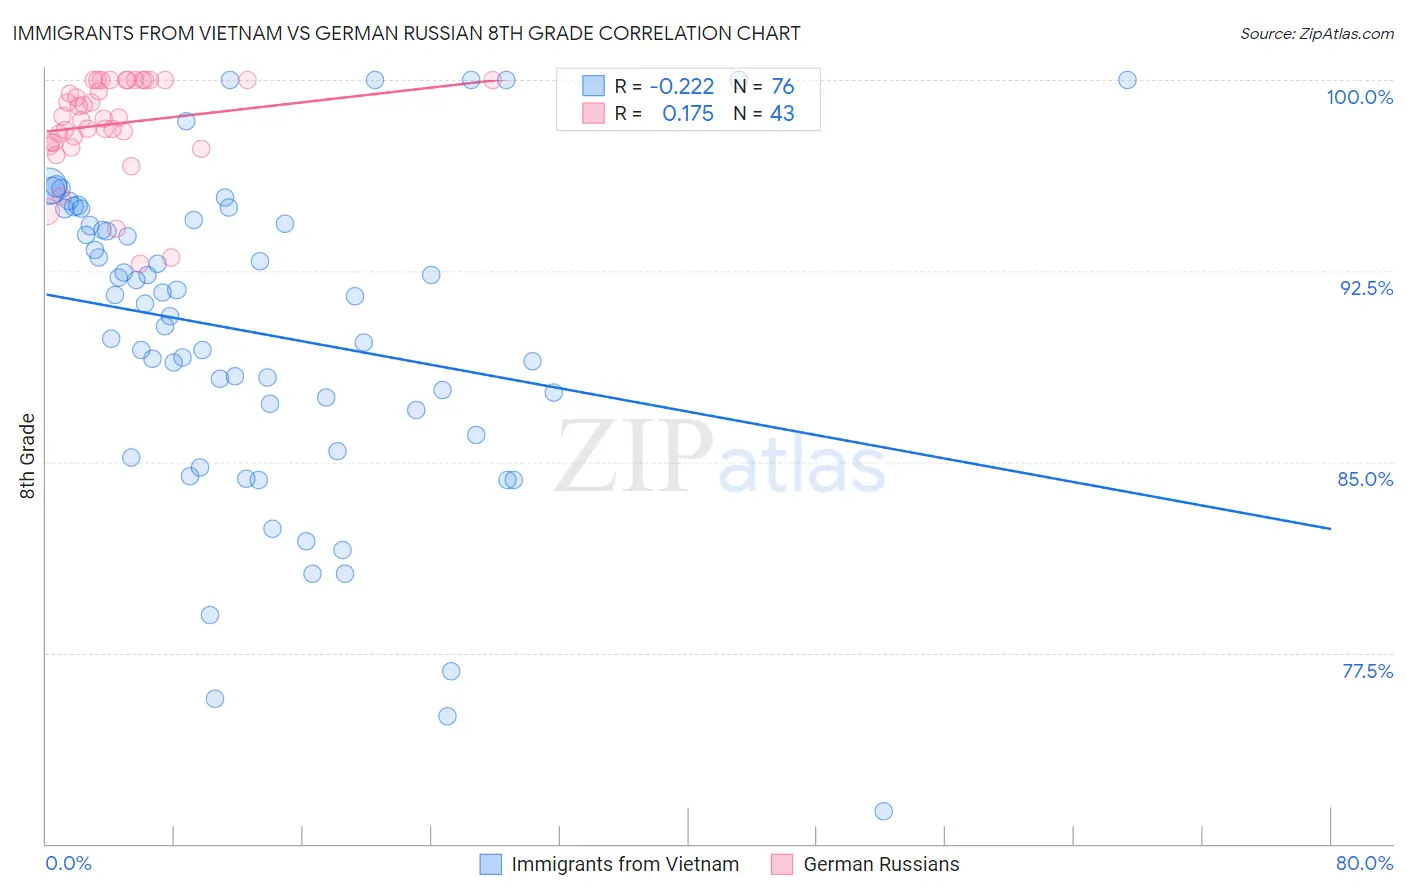
Immigrants from Vietnam vs German Russian 8th Grade Correlation Chart
The statistical analysis conducted on geographies consisting of 404,844,322 people shows a weak negative correlation between the proportion of Immigrants from Vietnam and percentage of population with at least 8th grade education in the United States with a correlation coefficient (R) of -0.222 and weighted average of 93.5%. Similarly, the statistical analysis conducted on geographies consisting of 96,461,984 people shows a poor positive correlation between the proportion of German Russians and percentage of population with at least 8th grade education in the United States with a correlation coefficient (R) of 0.175 and weighted average of 96.4%, a difference of 3.1%.
8th Grade Correlation Summary
| Measurement | Immigrants from Vietnam | German Russian |
| Minimum | 71.3% | 92.8% |
| Maximum | 100.0% | 100.0% |
| Range | 28.7% | 7.2% |
| Mean | 90.0% | 98.3% |
| Median | 91.4% | 98.5% |
| Interquartile 25% (IQ1) | 86.5% | 97.5% |
| Interquartile 75% (IQ3) | 94.4% | 100.0% |
| Interquartile Range (IQR) | 7.9% | 2.5% |
| Standard Deviation (Sample) | 6.2% | 1.9% |
| Standard Deviation (Population) | 6.2% | 1.9% |
Similar Demographics by 8th Grade
Demographics Similar to Immigrants from Vietnam by 8th Grade
In terms of 8th grade, the demographic groups most similar to Immigrants from Vietnam are Immigrants from Caribbean (93.5%, a difference of 0.010%), Vietnamese (93.5%, a difference of 0.010%), Cape Verdean (93.5%, a difference of 0.040%), Immigrants from Bangladesh (93.6%, a difference of 0.080%), and Immigrants (93.6%, a difference of 0.090%).
| Demographics | Rating | Rank | 8th Grade |
| Immigrants | Portugal | 0.0 /100 | #307 | Tragic 93.8% |
| Ecuadorians | 0.0 /100 | #308 | Tragic 93.6% |
| Immigrants | Immigrants | 0.0 /100 | #309 | Tragic 93.6% |
| Japanese | 0.0 /100 | #310 | Tragic 93.6% |
| Immigrants | Bangladesh | 0.0 /100 | #311 | Tragic 93.6% |
| Cape Verdeans | 0.0 /100 | #312 | Tragic 93.5% |
| Immigrants | Caribbean | 0.0 /100 | #313 | Tragic 93.5% |
| Immigrants | Vietnam | 0.0 /100 | #314 | Tragic 93.5% |
| Vietnamese | 0.0 /100 | #315 | Tragic 93.5% |
| Immigrants | Cambodia | 0.0 /100 | #316 | Tragic 93.3% |
| Immigrants | Ecuador | 0.0 /100 | #317 | Tragic 93.3% |
| Puerto Ricans | 0.0 /100 | #318 | Tragic 93.2% |
| Immigrants | Cuba | 0.0 /100 | #319 | Tragic 93.2% |
| Immigrants | Fiji | 0.0 /100 | #320 | Tragic 93.2% |
| Belizeans | 0.0 /100 | #321 | Tragic 93.1% |
Demographics Similar to German Russians by 8th Grade
In terms of 8th grade, the demographic groups most similar to German Russians are Immigrants from Singapore (96.4%, a difference of 0.0%), Immigrants from Sweden (96.4%, a difference of 0.010%), Thai (96.4%, a difference of 0.010%), Menominee (96.4%, a difference of 0.010%), and Immigrants from Denmark (96.4%, a difference of 0.010%).
| Demographics | Rating | Rank | 8th Grade |
| Immigrants | Western Europe | 99.0 /100 | #88 | Exceptional 96.4% |
| Chickasaw | 98.9 /100 | #89 | Exceptional 96.4% |
| Immigrants | Sweden | 98.9 /100 | #90 | Exceptional 96.4% |
| Thais | 98.9 /100 | #91 | Exceptional 96.4% |
| Menominee | 98.9 /100 | #92 | Exceptional 96.4% |
| Immigrants | Denmark | 98.8 /100 | #93 | Exceptional 96.4% |
| Immigrants | Singapore | 98.8 /100 | #94 | Exceptional 96.4% |
| German Russians | 98.8 /100 | #95 | Exceptional 96.4% |
| Potawatomi | 98.7 /100 | #96 | Exceptional 96.4% |
| Osage | 98.7 /100 | #97 | Exceptional 96.4% |
| Immigrants | Germany | 98.7 /100 | #98 | Exceptional 96.4% |
| Cree | 98.6 /100 | #99 | Exceptional 96.4% |
| Immigrants | Czechoslovakia | 98.6 /100 | #100 | Exceptional 96.4% |
| Bhutanese | 98.2 /100 | #101 | Exceptional 96.4% |
| South Africans | 98.2 /100 | #102 | Exceptional 96.4% |