Immigrants from Saudi Arabia vs German Russian 8th Grade
COMPARE
Immigrants from Saudi Arabia
German Russian
8th Grade
8th Grade Comparison
Immigrants from Saudi Arabia
German Russians
96.3%
8TH GRADE
98.0/ 100
METRIC RATING
103rd/ 347
METRIC RANK
96.4%
8TH GRADE
98.8/ 100
METRIC RATING
95th/ 347
METRIC RANK
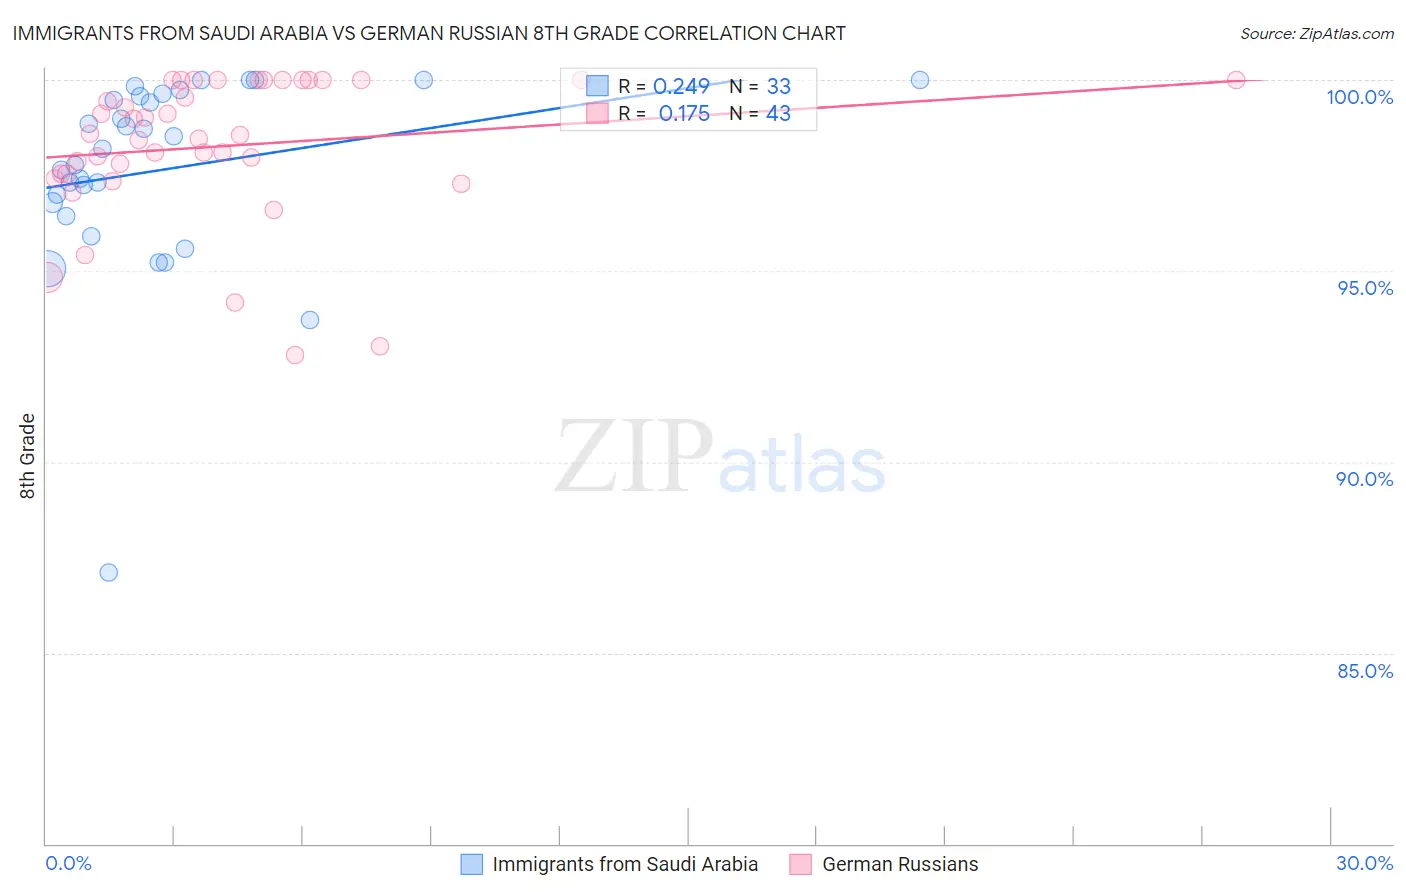
Immigrants from Saudi Arabia vs German Russian 8th Grade Correlation Chart
The statistical analysis conducted on geographies consisting of 164,277,573 people shows a weak positive correlation between the proportion of Immigrants from Saudi Arabia and percentage of population with at least 8th grade education in the United States with a correlation coefficient (R) of 0.249 and weighted average of 96.3%. Similarly, the statistical analysis conducted on geographies consisting of 96,461,984 people shows a poor positive correlation between the proportion of German Russians and percentage of population with at least 8th grade education in the United States with a correlation coefficient (R) of 0.175 and weighted average of 96.4%, a difference of 0.080%.
8th Grade Correlation Summary
| Measurement | Immigrants from Saudi Arabia | German Russian |
| Minimum | 87.1% | 92.8% |
| Maximum | 100.0% | 100.0% |
| Range | 12.9% | 7.2% |
| Mean | 97.7% | 98.3% |
| Median | 98.2% | 98.5% |
| Interquartile 25% (IQ1) | 96.6% | 97.5% |
| Interquartile 75% (IQ3) | 99.6% | 100.0% |
| Interquartile Range (IQR) | 3.0% | 2.5% |
| Standard Deviation (Sample) | 2.6% | 1.9% |
| Standard Deviation (Population) | 2.5% | 1.9% |
Demographics Similar to Immigrants from Saudi Arabia and German Russians by 8th Grade
In terms of 8th grade, the demographic groups most similar to Immigrants from Saudi Arabia are Kiowa (96.3%, a difference of 0.0%), Immigrants from North Macedonia (96.3%, a difference of 0.0%), Okinawan (96.3%, a difference of 0.0%), South African (96.4%, a difference of 0.010%), and Immigrants from Latvia (96.3%, a difference of 0.010%). Similarly, the demographic groups most similar to German Russians are Immigrants from Singapore (96.4%, a difference of 0.0%), Immigrants from Sweden (96.4%, a difference of 0.010%), Thai (96.4%, a difference of 0.010%), Menominee (96.4%, a difference of 0.010%), and Immigrants from Denmark (96.4%, a difference of 0.010%).
| Demographics | Rating | Rank | 8th Grade |
| Chickasaw | 98.9 /100 | #89 | Exceptional 96.4% |
| Immigrants | Sweden | 98.9 /100 | #90 | Exceptional 96.4% |
| Thais | 98.9 /100 | #91 | Exceptional 96.4% |
| Menominee | 98.9 /100 | #92 | Exceptional 96.4% |
| Immigrants | Denmark | 98.8 /100 | #93 | Exceptional 96.4% |
| Immigrants | Singapore | 98.8 /100 | #94 | Exceptional 96.4% |
| German Russians | 98.8 /100 | #95 | Exceptional 96.4% |
| Potawatomi | 98.7 /100 | #96 | Exceptional 96.4% |
| Osage | 98.7 /100 | #97 | Exceptional 96.4% |
| Immigrants | Germany | 98.7 /100 | #98 | Exceptional 96.4% |
| Cree | 98.6 /100 | #99 | Exceptional 96.4% |
| Immigrants | Czechoslovakia | 98.6 /100 | #100 | Exceptional 96.4% |
| Bhutanese | 98.2 /100 | #101 | Exceptional 96.4% |
| South Africans | 98.2 /100 | #102 | Exceptional 96.4% |
| Immigrants | Saudi Arabia | 98.0 /100 | #103 | Exceptional 96.3% |
| Kiowa | 98.0 /100 | #104 | Exceptional 96.3% |
| Immigrants | North Macedonia | 98.0 /100 | #105 | Exceptional 96.3% |
| Okinawans | 98.0 /100 | #106 | Exceptional 96.3% |
| Immigrants | Latvia | 97.8 /100 | #107 | Exceptional 96.3% |
| Lebanese | 97.5 /100 | #108 | Exceptional 96.3% |
| Iroquois | 97.5 /100 | #109 | Exceptional 96.3% |