Immigrants from Uruguay vs Polish 7th Grade
COMPARE
Immigrants from Uruguay
Polish
7th Grade
7th Grade Comparison
Immigrants from Uruguay
Poles
95.2%
7TH GRADE
0.3/ 100
METRIC RATING
265th/ 347
METRIC RANK
97.6%
7TH GRADE
100.0/ 100
METRIC RATING
12th/ 347
METRIC RANK
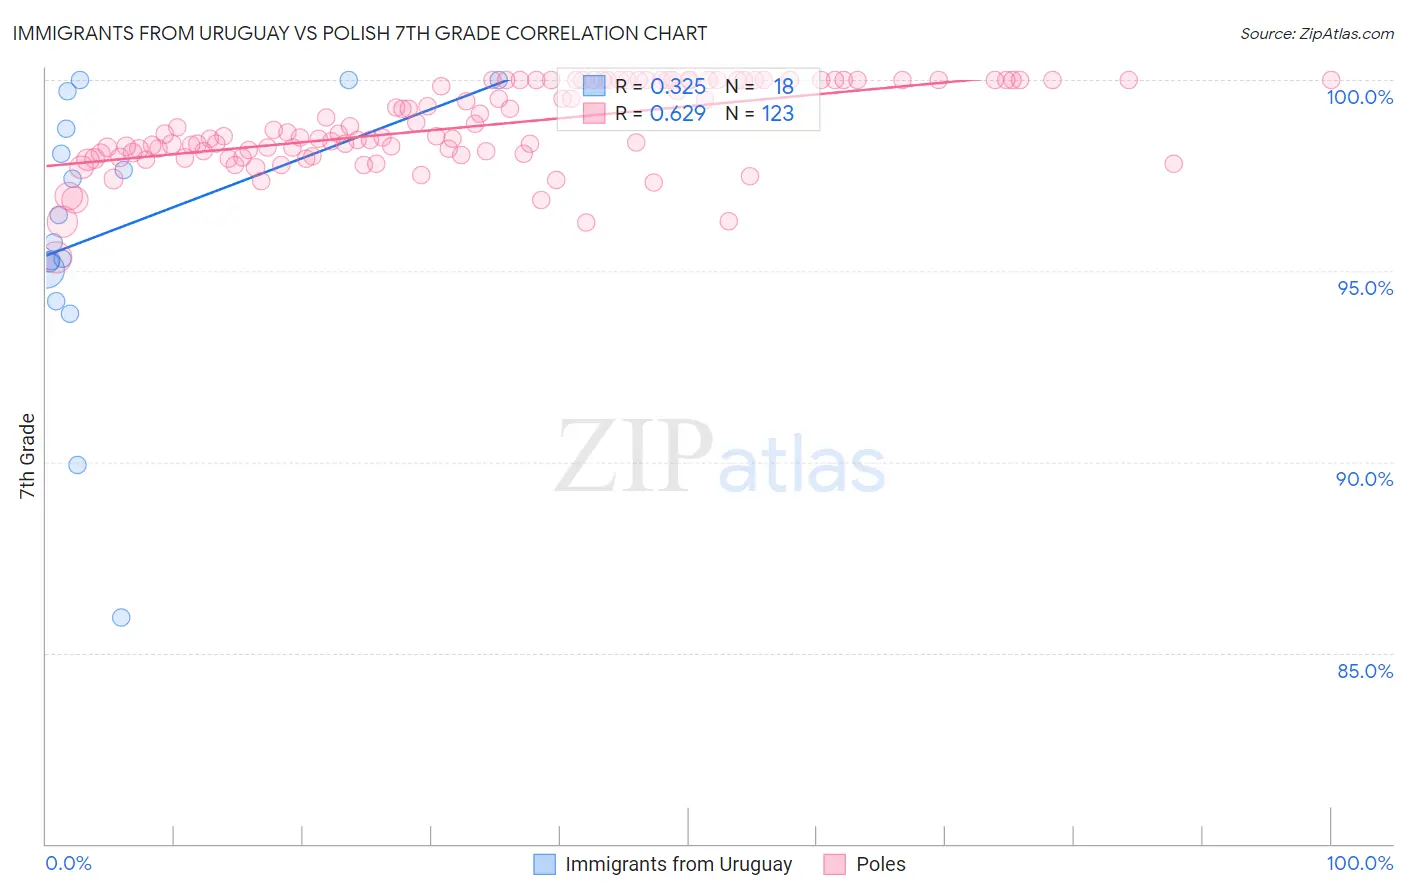
Immigrants from Uruguay vs Polish 7th Grade Correlation Chart
The statistical analysis conducted on geographies consisting of 133,259,667 people shows a mild positive correlation between the proportion of Immigrants from Uruguay and percentage of population with at least 7th grade education in the United States with a correlation coefficient (R) of 0.325 and weighted average of 95.2%. Similarly, the statistical analysis conducted on geographies consisting of 475,812,379 people shows a significant positive correlation between the proportion of Poles and percentage of population with at least 7th grade education in the United States with a correlation coefficient (R) of 0.629 and weighted average of 97.6%, a difference of 2.5%.
7th Grade Correlation Summary
| Measurement | Immigrants from Uruguay | Polish |
| Minimum | 85.9% | 95.4% |
| Maximum | 100.0% | 100.0% |
| Range | 14.1% | 4.6% |
| Mean | 96.0% | 98.8% |
| Median | 96.1% | 98.5% |
| Interquartile 25% (IQ1) | 95.0% | 98.1% |
| Interquartile 75% (IQ3) | 98.7% | 100.0% |
| Interquartile Range (IQR) | 3.7% | 1.9% |
| Standard Deviation (Sample) | 3.7% | 1.1% |
| Standard Deviation (Population) | 3.6% | 1.1% |
Similar Demographics by 7th Grade
Demographics Similar to Immigrants from Uruguay by 7th Grade
In terms of 7th grade, the demographic groups most similar to Immigrants from Uruguay are Immigrants from Ghana (95.2%, a difference of 0.0%), Yuman (95.2%, a difference of 0.020%), Immigrants from Hong Kong (95.2%, a difference of 0.020%), Immigrants from Nigeria (95.2%, a difference of 0.030%), and South American (95.2%, a difference of 0.050%).
| Demographics | Rating | Rank | 7th Grade |
| Ghanaians | 0.7 /100 | #258 | Tragic 95.3% |
| Immigrants | Costa Rica | 0.6 /100 | #259 | Tragic 95.3% |
| Afghans | 0.5 /100 | #260 | Tragic 95.3% |
| South Americans | 0.5 /100 | #261 | Tragic 95.2% |
| Immigrants | Somalia | 0.5 /100 | #262 | Tragic 95.2% |
| West Indians | 0.5 /100 | #263 | Tragic 95.2% |
| Immigrants | Nigeria | 0.4 /100 | #264 | Tragic 95.2% |
| Immigrants | Uruguay | 0.3 /100 | #265 | Tragic 95.2% |
| Immigrants | Ghana | 0.3 /100 | #266 | Tragic 95.2% |
| Yuman | 0.3 /100 | #267 | Tragic 95.2% |
| Immigrants | Hong Kong | 0.3 /100 | #268 | Tragic 95.2% |
| Trinidadians and Tobagonians | 0.3 /100 | #269 | Tragic 95.2% |
| Houma | 0.2 /100 | #270 | Tragic 95.1% |
| Immigrants | South America | 0.2 /100 | #271 | Tragic 95.1% |
| Peruvians | 0.2 /100 | #272 | Tragic 95.1% |
Demographics Similar to Poles by 7th Grade
In terms of 7th grade, the demographic groups most similar to Poles are Alaskan Athabascan (97.6%, a difference of 0.010%), Slovene (97.6%, a difference of 0.020%), Swedish (97.6%, a difference of 0.030%), Pennsylvania German (97.6%, a difference of 0.040%), and English (97.6%, a difference of 0.060%).
| Demographics | Rating | Rank | 7th Grade |
| Dutch | 100.0 /100 | #5 | Exceptional 97.9% |
| Tsimshian | 100.0 /100 | #6 | Exceptional 97.8% |
| Norwegians | 100.0 /100 | #7 | Exceptional 97.8% |
| Slovaks | 100.0 /100 | #8 | Exceptional 97.8% |
| Germans | 100.0 /100 | #9 | Exceptional 97.7% |
| Slovenes | 100.0 /100 | #10 | Exceptional 97.6% |
| Alaskan Athabascans | 100.0 /100 | #11 | Exceptional 97.6% |
| Poles | 100.0 /100 | #12 | Exceptional 97.6% |
| Swedes | 100.0 /100 | #13 | Exceptional 97.6% |
| Pennsylvania Germans | 100.0 /100 | #14 | Exceptional 97.6% |
| English | 100.0 /100 | #15 | Exceptional 97.6% |
| Irish | 100.0 /100 | #16 | Exceptional 97.5% |
| Scottish | 100.0 /100 | #17 | Exceptional 97.5% |
| Tlingit-Haida | 100.0 /100 | #18 | Exceptional 97.5% |
| Lithuanians | 100.0 /100 | #19 | Exceptional 97.5% |