Costa Rican vs Polish 7th Grade
COMPARE
Costa Rican
Polish
7th Grade
7th Grade Comparison
Costa Ricans
Poles
95.5%
7TH GRADE
3.3/ 100
METRIC RATING
232nd/ 347
METRIC RANK
97.6%
7TH GRADE
100.0/ 100
METRIC RATING
12th/ 347
METRIC RANK
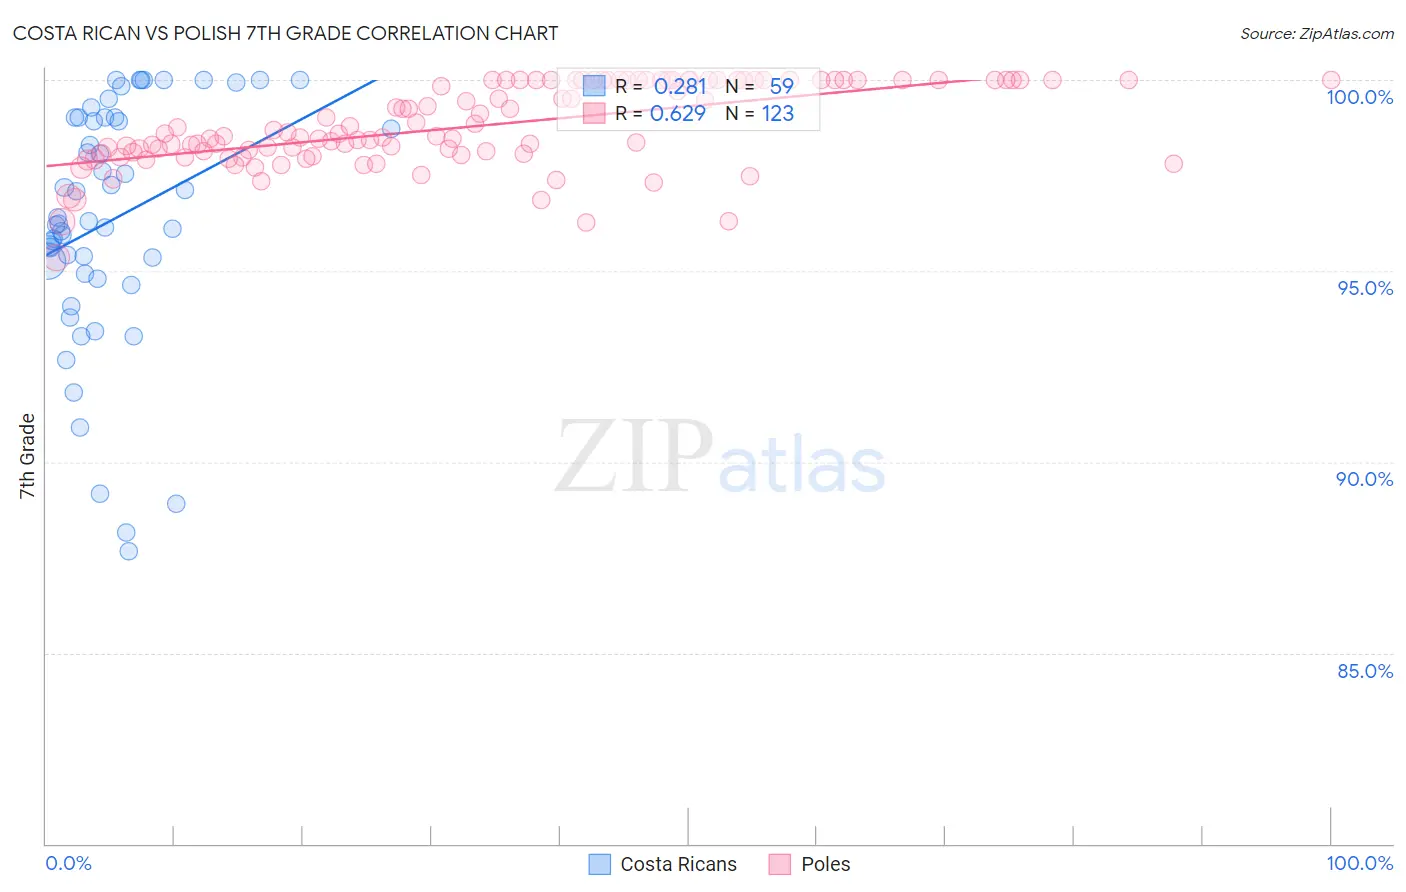
Costa Rican vs Polish 7th Grade Correlation Chart
The statistical analysis conducted on geographies consisting of 253,601,897 people shows a weak positive correlation between the proportion of Costa Ricans and percentage of population with at least 7th grade education in the United States with a correlation coefficient (R) of 0.281 and weighted average of 95.5%. Similarly, the statistical analysis conducted on geographies consisting of 475,812,379 people shows a significant positive correlation between the proportion of Poles and percentage of population with at least 7th grade education in the United States with a correlation coefficient (R) of 0.629 and weighted average of 97.6%, a difference of 2.2%.
7th Grade Correlation Summary
| Measurement | Costa Rican | Polish |
| Minimum | 87.6% | 95.4% |
| Maximum | 100.0% | 100.0% |
| Range | 12.4% | 4.6% |
| Mean | 96.3% | 98.8% |
| Median | 96.3% | 98.5% |
| Interquartile 25% (IQ1) | 94.9% | 98.1% |
| Interquartile 75% (IQ3) | 99.0% | 100.0% |
| Interquartile Range (IQR) | 4.1% | 1.9% |
| Standard Deviation (Sample) | 3.2% | 1.1% |
| Standard Deviation (Population) | 3.1% | 1.1% |
Similar Demographics by 7th Grade
Demographics Similar to Costa Ricans by 7th Grade
In terms of 7th grade, the demographic groups most similar to Costa Ricans are Immigrants from Indonesia (95.5%, a difference of 0.0%), Nigerian (95.5%, a difference of 0.020%), Senegalese (95.6%, a difference of 0.030%), Immigrants from Africa (95.5%, a difference of 0.030%), and Native/Alaskan (95.6%, a difference of 0.040%).
| Demographics | Rating | Rank | 7th Grade |
| Immigrants | Malaysia | 6.2 /100 | #225 | Tragic 95.6% |
| Immigrants | Eastern Asia | 5.8 /100 | #226 | Tragic 95.6% |
| Immigrants | Western Asia | 5.4 /100 | #227 | Tragic 95.6% |
| Immigrants | Eastern Africa | 5.1 /100 | #228 | Tragic 95.6% |
| Immigrants | Panama | 4.9 /100 | #229 | Tragic 95.6% |
| Natives/Alaskans | 4.2 /100 | #230 | Tragic 95.6% |
| Senegalese | 4.0 /100 | #231 | Tragic 95.6% |
| Costa Ricans | 3.3 /100 | #232 | Tragic 95.5% |
| Immigrants | Indonesia | 3.3 /100 | #233 | Tragic 95.5% |
| Nigerians | 3.0 /100 | #234 | Tragic 95.5% |
| Immigrants | Africa | 2.7 /100 | #235 | Tragic 95.5% |
| Asians | 2.6 /100 | #236 | Tragic 95.5% |
| Immigrants | Asia | 2.3 /100 | #237 | Tragic 95.5% |
| Indians (Asian) | 2.3 /100 | #238 | Tragic 95.5% |
| Jamaicans | 2.2 /100 | #239 | Tragic 95.5% |
Demographics Similar to Poles by 7th Grade
In terms of 7th grade, the demographic groups most similar to Poles are Alaskan Athabascan (97.6%, a difference of 0.010%), Slovene (97.6%, a difference of 0.020%), Swedish (97.6%, a difference of 0.030%), Pennsylvania German (97.6%, a difference of 0.040%), and English (97.6%, a difference of 0.060%).
| Demographics | Rating | Rank | 7th Grade |
| Dutch | 100.0 /100 | #5 | Exceptional 97.9% |
| Tsimshian | 100.0 /100 | #6 | Exceptional 97.8% |
| Norwegians | 100.0 /100 | #7 | Exceptional 97.8% |
| Slovaks | 100.0 /100 | #8 | Exceptional 97.8% |
| Germans | 100.0 /100 | #9 | Exceptional 97.7% |
| Slovenes | 100.0 /100 | #10 | Exceptional 97.6% |
| Alaskan Athabascans | 100.0 /100 | #11 | Exceptional 97.6% |
| Poles | 100.0 /100 | #12 | Exceptional 97.6% |
| Swedes | 100.0 /100 | #13 | Exceptional 97.6% |
| Pennsylvania Germans | 100.0 /100 | #14 | Exceptional 97.6% |
| English | 100.0 /100 | #15 | Exceptional 97.6% |
| Irish | 100.0 /100 | #16 | Exceptional 97.5% |
| Scottish | 100.0 /100 | #17 | Exceptional 97.5% |
| Tlingit-Haida | 100.0 /100 | #18 | Exceptional 97.5% |
| Lithuanians | 100.0 /100 | #19 | Exceptional 97.5% |