Immigrants from Uruguay vs Immigrants from Northern Africa GED/Equivalency
COMPARE
Immigrants from Uruguay
Immigrants from Northern Africa
GED/Equivalency
GED/Equivalency Comparison
Immigrants from Uruguay
Immigrants from Northern Africa
84.4%
GED/EQUIVALENCY
4.6/ 100
METRIC RATING
229th/ 347
METRIC RANK
86.3%
GED/EQUIVALENCY
79.3/ 100
METRIC RATING
147th/ 347
METRIC RANK
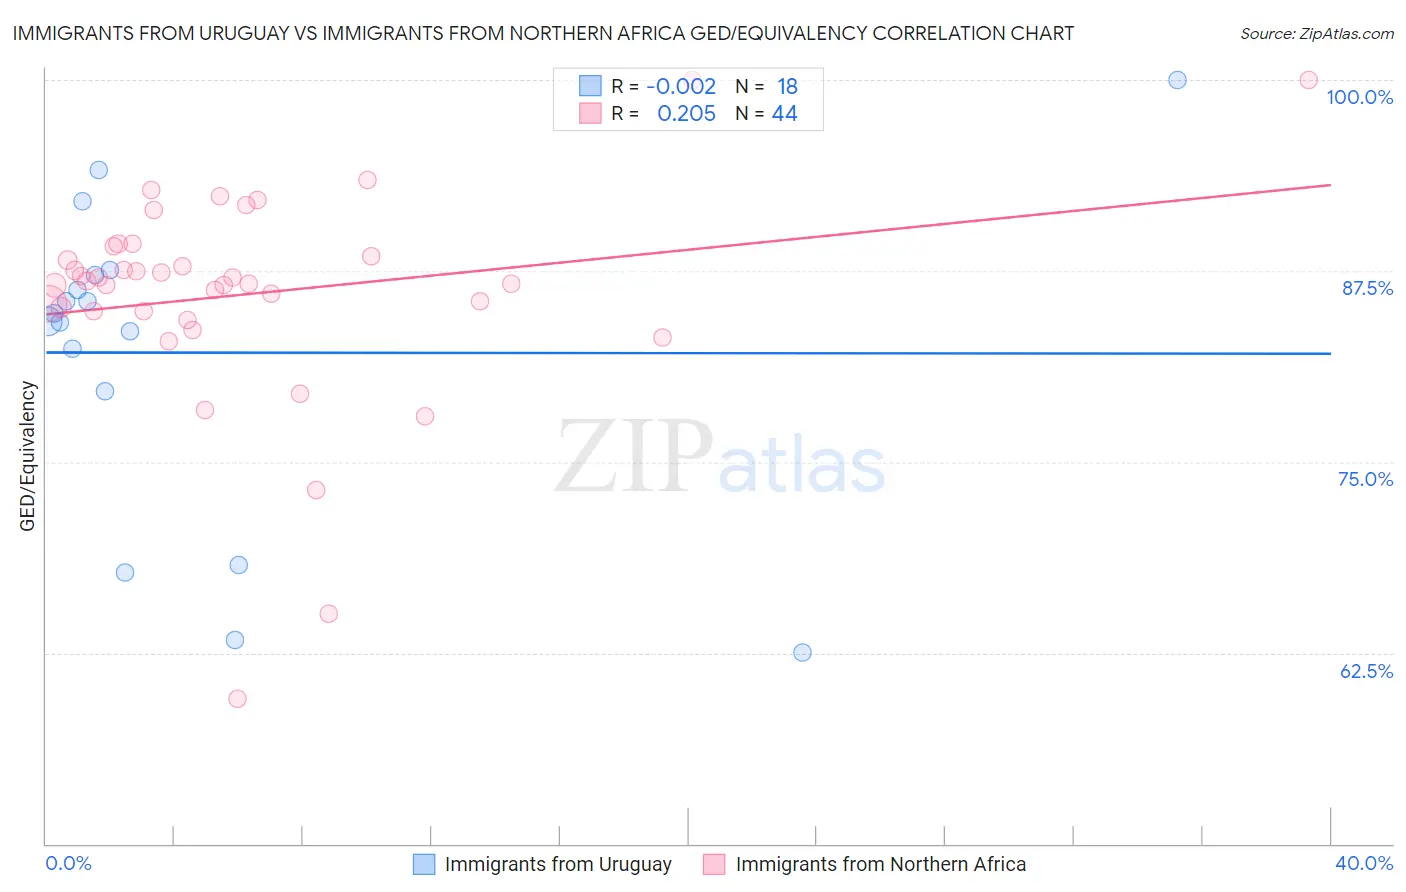
Immigrants from Uruguay vs Immigrants from Northern Africa GED/Equivalency Correlation Chart
The statistical analysis conducted on geographies consisting of 133,259,667 people shows no correlation between the proportion of Immigrants from Uruguay and percentage of population with at least ged/equivalency education in the United States with a correlation coefficient (R) of -0.002 and weighted average of 84.4%. Similarly, the statistical analysis conducted on geographies consisting of 321,196,768 people shows a weak positive correlation between the proportion of Immigrants from Northern Africa and percentage of population with at least ged/equivalency education in the United States with a correlation coefficient (R) of 0.205 and weighted average of 86.3%, a difference of 2.3%.
GED/Equivalency Correlation Summary
| Measurement | Immigrants from Uruguay | Immigrants from Northern Africa |
| Minimum | 62.5% | 59.5% |
| Maximum | 100.0% | 100.0% |
| Range | 37.5% | 40.5% |
| Mean | 82.2% | 86.0% |
| Median | 84.4% | 86.7% |
| Interquartile 25% (IQ1) | 79.7% | 84.9% |
| Interquartile 75% (IQ3) | 87.2% | 88.8% |
| Interquartile Range (IQR) | 7.6% | 3.9% |
| Standard Deviation (Sample) | 10.3% | 7.1% |
| Standard Deviation (Population) | 10.0% | 7.1% |
Similar Demographics by GED/Equivalency
Demographics Similar to Immigrants from Uruguay by GED/Equivalency
In terms of ged/equivalency, the demographic groups most similar to Immigrants from Uruguay are Immigrants from Colombia (84.4%, a difference of 0.010%), Immigrants from Liberia (84.4%, a difference of 0.030%), Immigrants from Middle Africa (84.4%, a difference of 0.030%), Immigrants from South America (84.4%, a difference of 0.050%), and Immigrants from Panama (84.4%, a difference of 0.060%).
| Demographics | Rating | Rank | GED/Equivalency |
| Iroquois | 7.5 /100 | #222 | Tragic 84.6% |
| Immigrants | Uzbekistan | 7.1 /100 | #223 | Tragic 84.6% |
| French American Indians | 6.3 /100 | #224 | Tragic 84.6% |
| Immigrants | Thailand | 5.8 /100 | #225 | Tragic 84.5% |
| Immigrants | Zaire | 5.5 /100 | #226 | Tragic 84.5% |
| Immigrants | Costa Rica | 5.4 /100 | #227 | Tragic 84.5% |
| Immigrants | Liberia | 4.9 /100 | #228 | Tragic 84.4% |
| Immigrants | Uruguay | 4.6 /100 | #229 | Tragic 84.4% |
| Immigrants | Colombia | 4.5 /100 | #230 | Tragic 84.4% |
| Immigrants | Middle Africa | 4.3 /100 | #231 | Tragic 84.4% |
| Immigrants | South America | 4.2 /100 | #232 | Tragic 84.4% |
| Immigrants | Panama | 4.1 /100 | #233 | Tragic 84.4% |
| Immigrants | Nigeria | 3.6 /100 | #234 | Tragic 84.3% |
| Ghanaians | 3.5 /100 | #235 | Tragic 84.3% |
| Immigrants | Eritrea | 3.5 /100 | #236 | Tragic 84.3% |
Demographics Similar to Immigrants from Northern Africa by GED/Equivalency
In terms of ged/equivalency, the demographic groups most similar to Immigrants from Northern Africa are Basque (86.4%, a difference of 0.0%), Immigrants from Poland (86.3%, a difference of 0.0%), Menominee (86.3%, a difference of 0.0%), Immigrants from Western Asia (86.3%, a difference of 0.020%), and Pakistani (86.4%, a difference of 0.030%).
| Demographics | Rating | Rank | GED/Equivalency |
| Paraguayans | 84.1 /100 | #140 | Excellent 86.5% |
| Laotians | 83.2 /100 | #141 | Excellent 86.5% |
| Immigrants | Indonesia | 82.4 /100 | #142 | Excellent 86.4% |
| Immigrants | Pakistan | 82.4 /100 | #143 | Excellent 86.4% |
| Bolivians | 82.1 /100 | #144 | Excellent 86.4% |
| Pakistanis | 80.4 /100 | #145 | Excellent 86.4% |
| Basques | 79.5 /100 | #146 | Good 86.4% |
| Immigrants | Northern Africa | 79.3 /100 | #147 | Good 86.3% |
| Immigrants | Poland | 79.3 /100 | #148 | Good 86.3% |
| Menominee | 79.3 /100 | #149 | Good 86.3% |
| Immigrants | Western Asia | 78.8 /100 | #150 | Good 86.3% |
| Immigrants | Bosnia and Herzegovina | 77.9 /100 | #151 | Good 86.3% |
| Brazilians | 77.2 /100 | #152 | Good 86.3% |
| Kenyans | 76.6 /100 | #153 | Good 86.3% |
| Armenians | 76.4 /100 | #154 | Good 86.3% |