Immigrants from Uganda vs Brazilian 4th Grade

COMPARE

Immigrants from Uganda
Race
Ancestry
AfghanAfricanAlaska NativeAlaskan AthabascanAlbanianAleutAlsatianAmericanApacheArabArapahoArgentineanArmenianAssyrian/Chaldean/SyriacAustralianAustrianBahamianBangladeshiBarbadianBasqueBelgianBelizeanBermudanBhutaneseBlackfeetBolivianBritishBritish West IndianBulgarianBurmeseCajunCambodianCanadianCape VerdeanCarpatho RusynCelticCentral AmericanCentral American IndianCherokeeCheyenneChickasawChileanChineseChippewaChoctawColombianColvilleComancheCosta RicanCreeCreekCroatianCrowCubanCypriotCzechCzechoslovakianDanishDelawareDominicanDutchDutch West IndianEastern EuropeanEcuadorianEgyptianEnglishEstonianEthiopianEuropeanFijianFilipinoFinnishFrenchFrench American IndianFrench CanadianGermanGerman RussianGhanaianGreekGuamanian/ChamorroGuatemalanGuyaneseHaitianHmongHonduranHopiHoumaHungarianIcelanderIndian (Asian)IndonesianInupiatIranianIraqiIrishIroquoisIsraeliItalianJamaicanJapaneseJordanianKenyanKiowaKoreanLaotianLatvianLebaneseLiberianLithuanianLumbeeLuxembourgerMacedonianMalaysianMalteseMarshalleseMenomineeMexicanMexican American IndianMongolianMoroccanNative HawaiianNavajoNepaleseNew ZealanderNicaraguanNigerianNorthern EuropeanNorwegianOkinawanOsageOttawaPaiutePakistaniPalestinianPanamanianParaguayanPennsylvania GermanPeruvianPimaPolishPortuguesePotawatomiPuebloPuerto RicanPuget Sound SalishRomanianRussianSalvadoranSamoanScandinavianScotch-IrishScottishSeminoleSenegaleseSerbianShoshoneSierra LeoneanSiouxSlavicSlovakSloveneSomaliSouth AfricanSouth AmericanSouth American IndianSoviet UnionSpaniardSpanishSpanish AmericanSpanish American IndianSri LankanSubsaharan AfricanSudaneseSwedishSwissSyrianTaiwaneseThaiTlingit-HaidaTohono O'OdhamTonganTrinidadian and TobagonianTsimshianTurkishU.S. Virgin IslanderUgandanUkrainianUruguayanUteVenezuelanVietnameseWelshWest IndianYakamaYaquiYugoslavianYumanYup'ikZimbabwean
Immigration
NonimmigrantsImmigrantsAfghanistanAfricaAlbaniaArgentinaArmeniaAsiaAustraliaAustriaBahamasBangladeshBarbadosBelarusBelgiumBelizeBoliviaBosnia and HerzegovinaBrazilBulgariaBurma/MyanmarCabo VerdeCambodiaCameroonCanadaCaribbeanCentral AmericaChileChinaColombiaCongoCosta RicaCroatiaCubaCzechoslovakiaDenmarkDominicaDominican RepublicEastern AfricaEastern AsiaEastern EuropeEcuadorEgyptEl SalvadorEnglandEritreaEthiopiaEuropeFijiFranceGermanyGhanaGreeceGrenadaGuatemalaGuyanaHaitiHondurasHong KongHungaryIndiaIndonesiaIranIraqIrelandIsraelItalyJamaicaJapanJordanKazakhstanKenyaKoreaKuwaitLaosLatin AmericaLatviaLebanonLiberiaLithuaniaMalaysiaMexicoMicronesiaMiddle AfricaMoldovaMoroccoNepalNetherlandsNicaraguaNigeriaNorth AmericaNorth MacedoniaNorthern AfricaNorthern EuropeNorwayOceaniaPakistanPanamaPeruPhilippinesPolandPortugalRomaniaRussiaSaudi ArabiaScotlandSenegalSerbiaSierra LeoneSingaporeSomaliaSouth AfricaSouth AmericaSouth Central AsiaSouth Eastern AsiaSouthern EuropeSpainSri LankaSt. Vincent and the GrenadinesSudanSwedenSwitzerlandSyriaTaiwanThailandTrinidad and TobagoTurkeyUgandaUkraineUruguayUzbekistanVenezuelaVietnamWest IndiesWestern AfricaWestern AsiaWestern EuropeYemenZaireZimbabweAzores
Brazilian
Race
Ancestry
AfghanAfricanAlaska NativeAlaskan AthabascanAlbanianAleutAlsatianAmericanApacheArabArapahoArgentineanArmenianAssyrian/Chaldean/SyriacAustralianAustrianBahamianBangladeshiBarbadianBasqueBelgianBelizeanBermudanBhutaneseBlackfeetBolivianBrazilianBritishBritish West IndianBulgarianBurmeseCajunCambodianCanadianCape VerdeanCarpatho RusynCelticCentral AmericanCentral American IndianCherokeeCheyenneChickasawChileanChineseChippewaChoctawColombianColvilleComancheCosta RicanCreeCreekCroatianCrowCubanCypriotCzechCzechoslovakianDanishDelawareDominicanDutchDutch West IndianEastern EuropeanEcuadorianEgyptianEnglishEstonianEthiopianEuropeanFijianFilipinoFinnishFrenchFrench American IndianFrench CanadianGermanGerman RussianGhanaianGreekGuamanian/ChamorroGuatemalanGuyaneseHaitianHmongHonduranHopiHoumaHungarianIcelanderIndian (Asian)IndonesianInupiatIranianIraqiIrishIroquoisIsraeliItalianJamaicanJapaneseJordanianKenyanKiowaKoreanLaotianLatvianLebaneseLiberianLithuanianLumbeeLuxembourgerMacedonianMalaysianMalteseMarshalleseMenomineeMexicanMexican American IndianMongolianMoroccanNative HawaiianNavajoNepaleseNew ZealanderNicaraguanNigerianNorthern EuropeanNorwegianOkinawanOsageOttawaPaiutePakistaniPalestinianPanamanianParaguayanPennsylvania GermanPeruvianPimaPolishPortuguesePotawatomiPuebloPuerto RicanPuget Sound SalishRomanianRussianSalvadoranSamoanScandinavianScotch-IrishScottishSeminoleSenegaleseSerbianShoshoneSierra LeoneanSiouxSlavicSlovakSloveneSomaliSouth AfricanSouth AmericanSouth American IndianSoviet UnionSpaniardSpanishSpanish AmericanSpanish American IndianSri LankanSubsaharan AfricanSudaneseSwedishSwissSyrianTaiwaneseThaiTlingit-HaidaTohono O'OdhamTonganTrinidadian and TobagonianTsimshianTurkishU.S. Virgin IslanderUgandanUkrainianUruguayanUteVenezuelanVietnameseWelshWest IndianYakamaYaquiYugoslavianYumanYup'ikZimbabwean
Immigration
NonimmigrantsImmigrantsAfghanistanAfricaAlbaniaArgentinaArmeniaAsiaAustraliaAustriaBahamasBangladeshBarbadosBelarusBelgiumBelizeBoliviaBosnia and HerzegovinaBrazilBulgariaBurma/MyanmarCabo VerdeCambodiaCameroonCanadaCaribbeanCentral AmericaChileChinaColombiaCongoCosta RicaCroatiaCubaCzechoslovakiaDenmarkDominicaDominican RepublicEastern AfricaEastern AsiaEastern EuropeEcuadorEgyptEl SalvadorEnglandEritreaEthiopiaEuropeFijiFranceGermanyGhanaGreeceGrenadaGuatemalaGuyanaHaitiHondurasHong KongHungaryIndiaIndonesiaIranIraqIrelandIsraelItalyJamaicaJapanJordanKazakhstanKenyaKoreaKuwaitLaosLatin AmericaLatviaLebanonLiberiaLithuaniaMalaysiaMexicoMicronesiaMiddle AfricaMoldovaMoroccoNepalNetherlandsNicaraguaNigeriaNorth AmericaNorth MacedoniaNorthern AfricaNorthern EuropeNorwayOceaniaPakistanPanamaPeruPhilippinesPolandPortugalRomaniaRussiaSaudi ArabiaScotlandSenegalSerbiaSierra LeoneSingaporeSomaliaSouth AfricaSouth AmericaSouth Central AsiaSouth Eastern AsiaSouthern EuropeSpainSri LankaSt. Vincent and the GrenadinesSudanSwedenSwitzerlandSyriaTaiwanThailandTrinidad and TobagoTurkeyUkraineUruguayUzbekistanVenezuelaVietnamWest IndiesWestern AfricaWestern AsiaWestern EuropeYemenZaireZimbabweAzores
4th Grade
Income
Poverty
Unemployment
Labor Participation
Family Structure
Vehicle Availability
Education Level
Disability

4th Grade Comparison

Immigrants from Uganda

Brazilians

Poor
Average
97.4%
4TH GRADE
19.8/ 100
METRIC RATING
200th/ 347
METRIC RANK
97.5%
4TH GRADE
51.5/ 100
METRIC RATING
171st/ 347
METRIC RANK

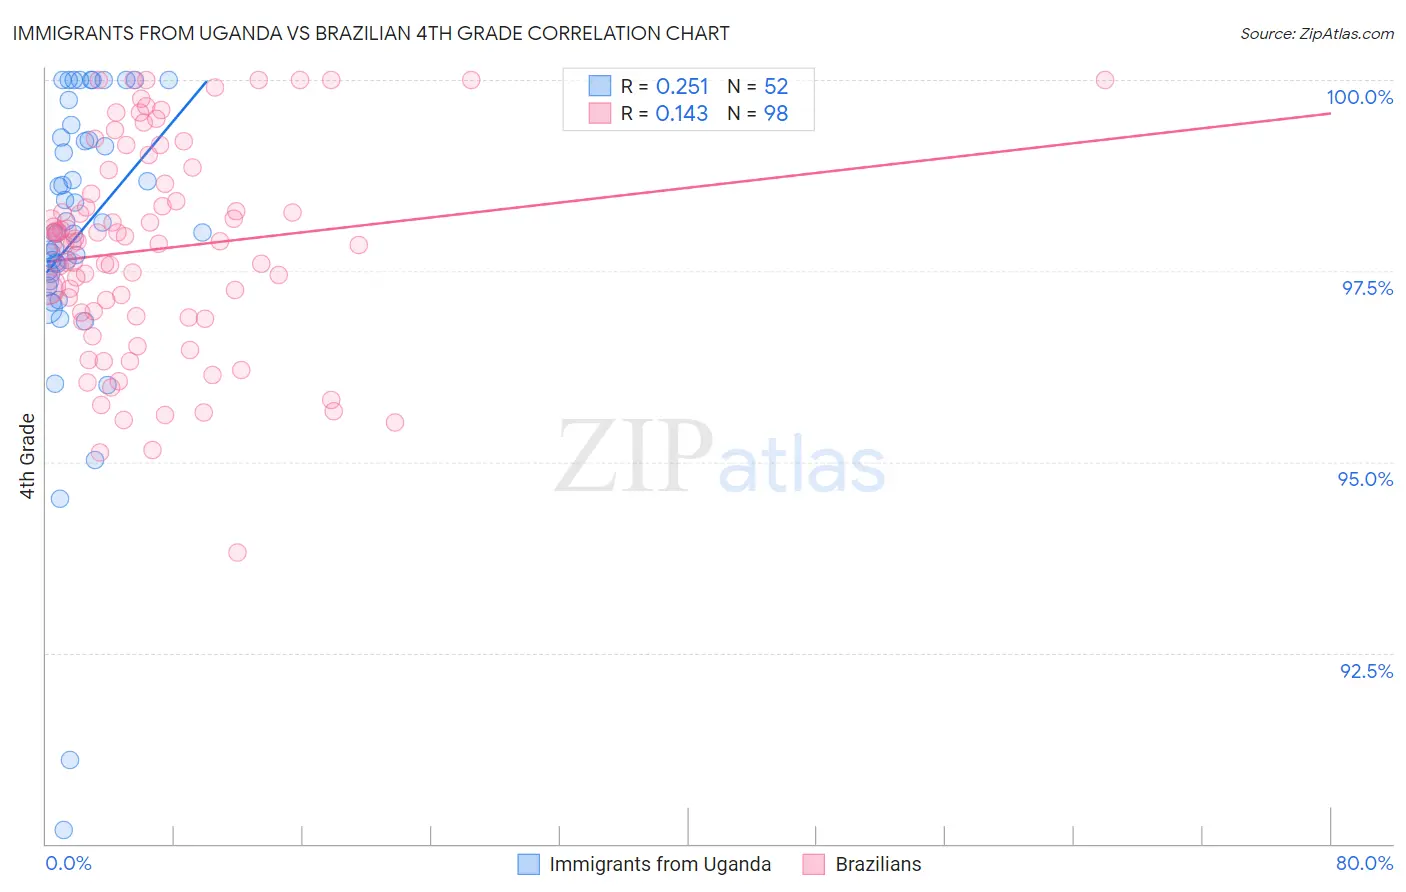
Immigrants from Uganda vs Brazilian 4th Grade Correlation Chart

The statistical analysis conducted on geographies consisting of 125,941,298 people shows a weak positive correlation between the proportion of Immigrants from Uganda and percentage of population with at least 4th grade education in the United States with a correlation coefficient (R) of 0.251 and weighted average of 97.4%. Similarly, the statistical analysis conducted on geographies consisting of 323,863,770 people shows a poor positive correlation between the proportion of Brazilians and percentage of population with at least 4th grade education in the United States with a correlation coefficient (R) of 0.143 and weighted average of 97.5%, a difference of 0.14%.
Immigrants from Uganda vs Brazilian 4th Grade

4th Grade Correlation Summary

MeasurementImmigrants from UgandaBrazilian
Minimum90.2%93.8%
Maximum100.0%100.0%
Range9.8%6.2%
Mean98.0%97.8%
Median98.0%97.9%
Interquartile 25% (IQ1)97.4%96.9%
Interquartile 75% (IQ3)99.2%98.6%
Interquartile Range (IQR)1.8%1.7%
Standard Deviation (Sample)2.0%1.4%
Standard Deviation (Population)2.0%1.4%

Similar Demographics by 4th Grade

Demographics Similar to Immigrants from Uganda by 4th Grade

In terms of 4th grade, the demographic groups most similar to Immigrants from Uganda are Native/Alaskan (97.4%, a difference of 0.010%), Guamanian/Chamorro (97.4%, a difference of 0.020%), Immigrants from Southern Europe (97.4%, a difference of 0.020%), Immigrants from Chile (97.4%, a difference of 0.020%), and Hawaiian (97.4%, a difference of 0.030%).
DemographicsRating | Rank4th Grade
Immigrants | Egypt
30.1
/100
|
#193
Fair
97.4%
Portuguese
29.2
/100
|
#194
Fair
97.4%
Paraguayans
28.9
/100
|
#195
Fair
97.4%
Immigrants | Albania
27.7
/100
|
#196
Fair
97.4%
Hawaiians
25.6
/100
|
#197
Fair
97.4%
Guamanians/Chamorros
23.0
/100
|
#198
Fair
97.4%
Natives/Alaskans
20.6
/100
|
#199
Fair
97.4%
Immigrants | Uganda
19.8
/100
|
#200
Poor
97.4%
Immigrants | Southern Europe
16.2
/100
|
#201
Poor
97.4%
Immigrants | Chile
16.1
/100
|
#202
Poor
97.4%
Immigrants | Northern Africa
15.1
/100
|
#203
Poor
97.4%
Africans
14.6
/100
|
#204
Poor
97.4%
Paiute
13.2
/100
|
#205
Poor
97.3%
Immigrants | Zaire
12.8
/100
|
#206
Poor
97.3%
Moroccans
11.3
/100
|
#207
Poor
97.3%

Demographics Similar to Brazilians by 4th Grade

In terms of 4th grade, the demographic groups most similar to Brazilians are Immigrants from Spain (97.5%, a difference of 0.0%), Immigrants from Sri Lanka (97.5%, a difference of 0.0%), Immigrants from Korea (97.5%, a difference of 0.0%), Chilean (97.5%, a difference of 0.010%), and Egyptian (97.5%, a difference of 0.010%).
DemographicsRating | Rank4th Grade
Ugandans
58.9
/100
|
#164
Average
97.6%
Venezuelans
58.7
/100
|
#165
Average
97.6%
Kenyans
56.5
/100
|
#166
Average
97.5%
Immigrants | Poland
55.9
/100
|
#167
Average
97.5%
Immigrants | Belarus
55.8
/100
|
#168
Average
97.5%
Chileans
54.4
/100
|
#169
Average
97.5%
Immigrants | Spain
51.8
/100
|
#170
Average
97.5%
Brazilians
51.5
/100
|
#171
Average
97.5%
Immigrants | Sri Lanka
51.1
/100
|
#172
Average
97.5%
Immigrants | Korea
50.6
/100
|
#173
Average
97.5%
Egyptians
50.0
/100
|
#174
Average
97.5%
Immigrants | Micronesia
49.6
/100
|
#175
Average
97.5%
Arabs
48.7
/100
|
#176
Average
97.5%
Immigrants | Brazil
46.1
/100
|
#177
Average
97.5%
Comanche
45.3
/100
|
#178
Average
97.5%