Cree vs Brazilian 4th Grade
COMPARE
Cree
Brazilian
4th Grade
4th Grade Comparison
Cree
Brazilians
97.9%
4TH GRADE
98.1/ 100
METRIC RATING
101st/ 347
METRIC RANK
97.5%
4TH GRADE
51.5/ 100
METRIC RATING
171st/ 347
METRIC RANK
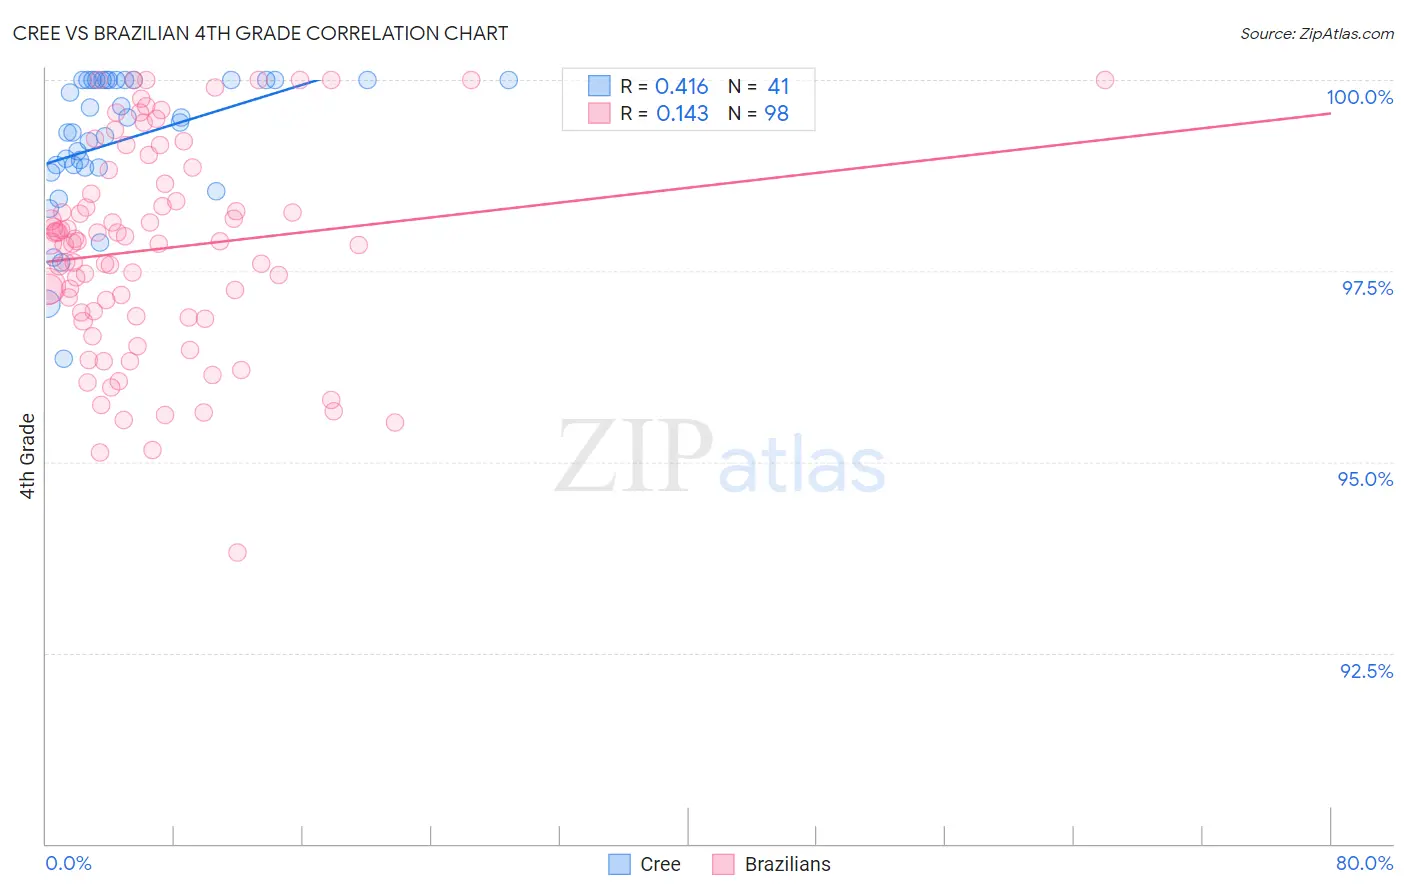
Cree vs Brazilian 4th Grade Correlation Chart
The statistical analysis conducted on geographies consisting of 76,211,744 people shows a moderate positive correlation between the proportion of Cree and percentage of population with at least 4th grade education in the United States with a correlation coefficient (R) of 0.416 and weighted average of 97.9%. Similarly, the statistical analysis conducted on geographies consisting of 323,863,770 people shows a poor positive correlation between the proportion of Brazilians and percentage of population with at least 4th grade education in the United States with a correlation coefficient (R) of 0.143 and weighted average of 97.5%, a difference of 0.37%.
4th Grade Correlation Summary
| Measurement | Cree | Brazilian |
| Minimum | 96.4% | 93.8% |
| Maximum | 100.0% | 100.0% |
| Range | 3.6% | 6.2% |
| Mean | 99.2% | 97.8% |
| Median | 99.4% | 97.9% |
| Interquartile 25% (IQ1) | 98.9% | 96.9% |
| Interquartile 75% (IQ3) | 100.0% | 98.6% |
| Interquartile Range (IQR) | 1.1% | 1.7% |
| Standard Deviation (Sample) | 0.90% | 1.4% |
| Standard Deviation (Population) | 0.89% | 1.4% |
Similar Demographics by 4th Grade
Demographics Similar to Cree by 4th Grade
In terms of 4th grade, the demographic groups most similar to Cree are Yugoslavian (97.9%, a difference of 0.0%), South African (97.9%, a difference of 0.010%), Turkish (97.9%, a difference of 0.010%), Choctaw (97.9%, a difference of 0.010%), and Immigrants from Germany (97.9%, a difference of 0.020%).
| Demographics | Rating | Rank | 4th Grade |
| Shoshone | 98.7 /100 | #94 | Exceptional 97.9% |
| Immigrants | Germany | 98.5 /100 | #95 | Exceptional 97.9% |
| Romanians | 98.4 /100 | #96 | Exceptional 97.9% |
| Cheyenne | 98.4 /100 | #97 | Exceptional 97.9% |
| South Africans | 98.2 /100 | #98 | Exceptional 97.9% |
| Turks | 98.2 /100 | #99 | Exceptional 97.9% |
| Yugoslavians | 98.1 /100 | #100 | Exceptional 97.9% |
| Cree | 98.1 /100 | #101 | Exceptional 97.9% |
| Choctaw | 97.9 /100 | #102 | Exceptional 97.9% |
| Puget Sound Salish | 97.7 /100 | #103 | Exceptional 97.9% |
| Immigrants | Nonimmigrants | 97.5 /100 | #104 | Exceptional 97.9% |
| German Russians | 97.5 /100 | #105 | Exceptional 97.9% |
| Immigrants | Czechoslovakia | 97.5 /100 | #106 | Exceptional 97.9% |
| Bhutanese | 97.4 /100 | #107 | Exceptional 97.9% |
| Immigrants | Singapore | 97.3 /100 | #108 | Exceptional 97.9% |
Demographics Similar to Brazilians by 4th Grade
In terms of 4th grade, the demographic groups most similar to Brazilians are Immigrants from Spain (97.5%, a difference of 0.0%), Immigrants from Sri Lanka (97.5%, a difference of 0.0%), Immigrants from Korea (97.5%, a difference of 0.0%), Chilean (97.5%, a difference of 0.010%), and Egyptian (97.5%, a difference of 0.010%).
| Demographics | Rating | Rank | 4th Grade |
| Ugandans | 58.9 /100 | #164 | Average 97.6% |
| Venezuelans | 58.7 /100 | #165 | Average 97.6% |
| Kenyans | 56.5 /100 | #166 | Average 97.5% |
| Immigrants | Poland | 55.9 /100 | #167 | Average 97.5% |
| Immigrants | Belarus | 55.8 /100 | #168 | Average 97.5% |
| Chileans | 54.4 /100 | #169 | Average 97.5% |
| Immigrants | Spain | 51.8 /100 | #170 | Average 97.5% |
| Brazilians | 51.5 /100 | #171 | Average 97.5% |
| Immigrants | Sri Lanka | 51.1 /100 | #172 | Average 97.5% |
| Immigrants | Korea | 50.6 /100 | #173 | Average 97.5% |
| Egyptians | 50.0 /100 | #174 | Average 97.5% |
| Immigrants | Micronesia | 49.6 /100 | #175 | Average 97.5% |
| Arabs | 48.7 /100 | #176 | Average 97.5% |
| Immigrants | Brazil | 46.1 /100 | #177 | Average 97.5% |
| Comanche | 45.3 /100 | #178 | Average 97.5% |