Immigrants from Taiwan vs Immigrants from Saudi Arabia 3rd Grade
COMPARE
Immigrants from Taiwan
Immigrants from Saudi Arabia
3rd Grade
3rd Grade Comparison
Immigrants from Taiwan
Immigrants from Saudi Arabia
97.7%
3RD GRADE
34.2/ 100
METRIC RATING
188th/ 347
METRIC RANK
98.0%
3RD GRADE
93.5/ 100
METRIC RATING
125th/ 347
METRIC RANK
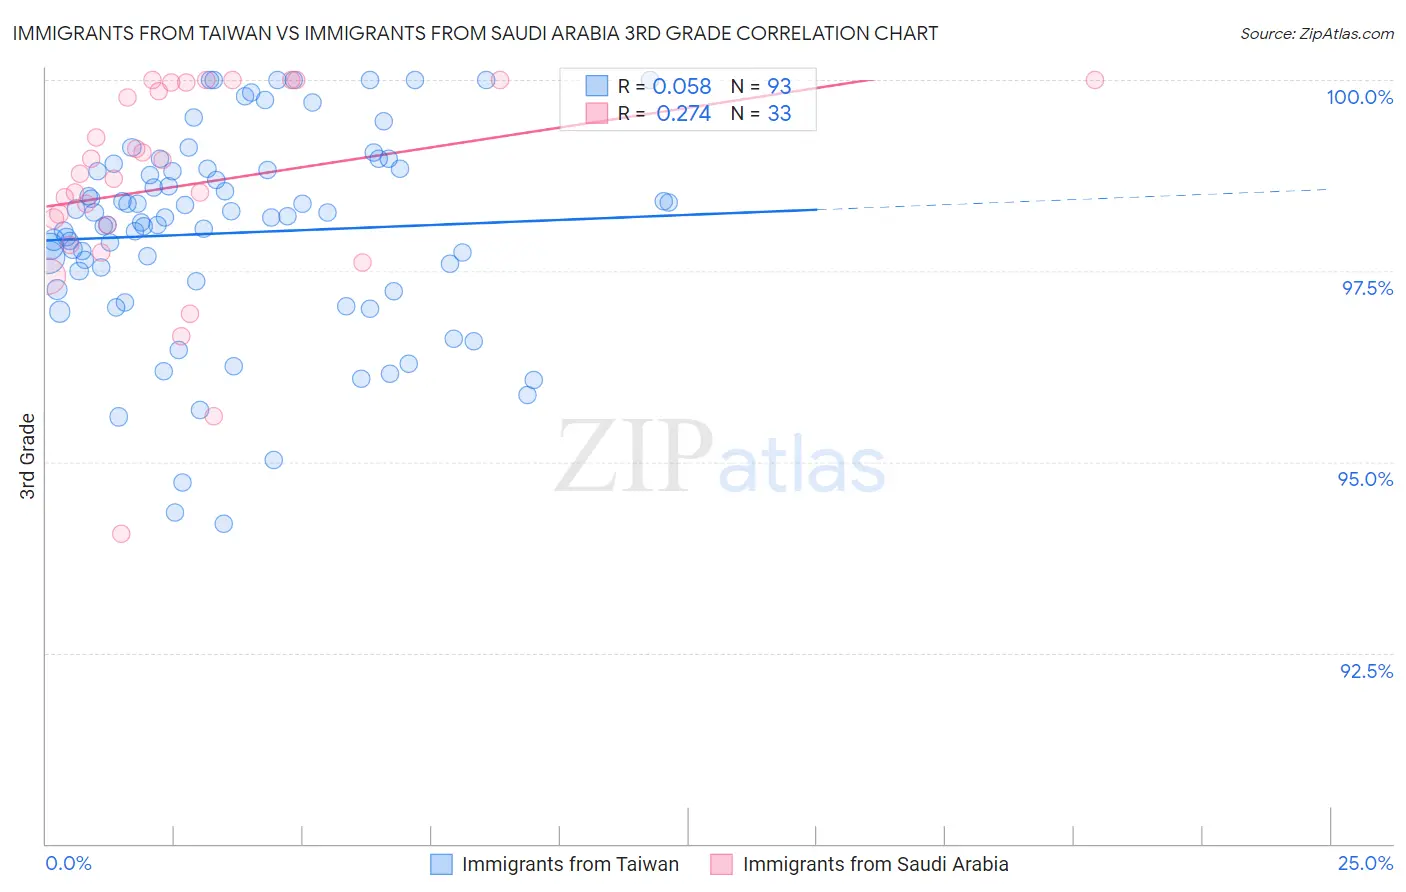
Immigrants from Taiwan vs Immigrants from Saudi Arabia 3rd Grade Correlation Chart
The statistical analysis conducted on geographies consisting of 298,069,082 people shows a slight positive correlation between the proportion of Immigrants from Taiwan and percentage of population with at least 3rd grade education in the United States with a correlation coefficient (R) of 0.058 and weighted average of 97.7%. Similarly, the statistical analysis conducted on geographies consisting of 164,277,573 people shows a weak positive correlation between the proportion of Immigrants from Saudi Arabia and percentage of population with at least 3rd grade education in the United States with a correlation coefficient (R) of 0.274 and weighted average of 98.0%, a difference of 0.28%.
3rd Grade Correlation Summary
| Measurement | Immigrants from Taiwan | Immigrants from Saudi Arabia |
| Minimum | 94.2% | 94.1% |
| Maximum | 100.0% | 100.0% |
| Range | 5.8% | 5.9% |
| Mean | 98.0% | 98.6% |
| Median | 98.2% | 98.8% |
| Interquartile 25% (IQ1) | 97.3% | 98.0% |
| Interquartile 75% (IQ3) | 98.8% | 100.0% |
| Interquartile Range (IQR) | 1.5% | 2.0% |
| Standard Deviation (Sample) | 1.3% | 1.4% |
| Standard Deviation (Population) | 1.3% | 1.4% |
Similar Demographics by 3rd Grade
Demographics Similar to Immigrants from Taiwan by 3rd Grade
In terms of 3rd grade, the demographic groups most similar to Immigrants from Taiwan are Native/Alaskan (97.7%, a difference of 0.0%), Pakistani (97.7%, a difference of 0.0%), Immigrants from Kazakhstan (97.7%, a difference of 0.010%), Immigrants from Argentina (97.7%, a difference of 0.010%), and Portuguese (97.7%, a difference of 0.010%).
| Demographics | Rating | Rank | 3rd Grade |
| Immigrants | Venezuela | 44.4 /100 | #181 | Average 97.7% |
| Argentineans | 42.9 /100 | #182 | Average 97.7% |
| Arabs | 40.0 /100 | #183 | Fair 97.7% |
| Immigrants | Kazakhstan | 37.4 /100 | #184 | Fair 97.7% |
| Immigrants | Argentina | 37.0 /100 | #185 | Fair 97.7% |
| Portuguese | 36.2 /100 | #186 | Fair 97.7% |
| Natives/Alaskans | 35.2 /100 | #187 | Fair 97.7% |
| Immigrants | Taiwan | 34.2 /100 | #188 | Fair 97.7% |
| Pakistanis | 34.2 /100 | #189 | Fair 97.7% |
| Panamanians | 31.5 /100 | #190 | Fair 97.7% |
| Blacks/African Americans | 29.6 /100 | #191 | Fair 97.7% |
| Mongolians | 29.1 /100 | #192 | Fair 97.7% |
| Immigrants | Kenya | 28.2 /100 | #193 | Fair 97.7% |
| Immigrants | Uganda | 27.4 /100 | #194 | Fair 97.7% |
| Immigrants | Egypt | 26.8 /100 | #195 | Fair 97.7% |
Demographics Similar to Immigrants from Saudi Arabia by 3rd Grade
In terms of 3rd grade, the demographic groups most similar to Immigrants from Saudi Arabia are Syrian (98.0%, a difference of 0.0%), Immigrants from Japan (98.0%, a difference of 0.0%), Immigrants from Zimbabwe (98.0%, a difference of 0.0%), Ute (98.0%, a difference of 0.0%), and Immigrants from Croatia (98.0%, a difference of 0.010%).
| Demographics | Rating | Rank | 3rd Grade |
| Iranians | 94.9 /100 | #118 | Exceptional 98.0% |
| Spanish | 94.8 /100 | #119 | Exceptional 98.0% |
| Immigrants | Croatia | 94.4 /100 | #120 | Exceptional 98.0% |
| Iroquois | 94.1 /100 | #121 | Exceptional 98.0% |
| Lebanese | 94.1 /100 | #122 | Exceptional 98.0% |
| Syrians | 93.8 /100 | #123 | Exceptional 98.0% |
| Immigrants | Japan | 93.7 /100 | #124 | Exceptional 98.0% |
| Immigrants | Saudi Arabia | 93.5 /100 | #125 | Exceptional 98.0% |
| Immigrants | Zimbabwe | 93.4 /100 | #126 | Exceptional 98.0% |
| Ute | 93.2 /100 | #127 | Exceptional 98.0% |
| Colville | 92.1 /100 | #128 | Exceptional 98.0% |
| Immigrants | Serbia | 91.9 /100 | #129 | Exceptional 98.0% |
| Immigrants | Europe | 91.2 /100 | #130 | Exceptional 98.0% |
| Immigrants | Bulgaria | 89.1 /100 | #131 | Excellent 97.9% |
| Immigrants | Hungary | 88.8 /100 | #132 | Excellent 97.9% |