Bolivian vs Immigrants from Saudi Arabia 3rd Grade
COMPARE
Bolivian
Immigrants from Saudi Arabia
3rd Grade
3rd Grade Comparison
Bolivians
Immigrants from Saudi Arabia
97.3%
3RD GRADE
0.6/ 100
METRIC RATING
255th/ 347
METRIC RANK
98.0%
3RD GRADE
93.5/ 100
METRIC RATING
125th/ 347
METRIC RANK
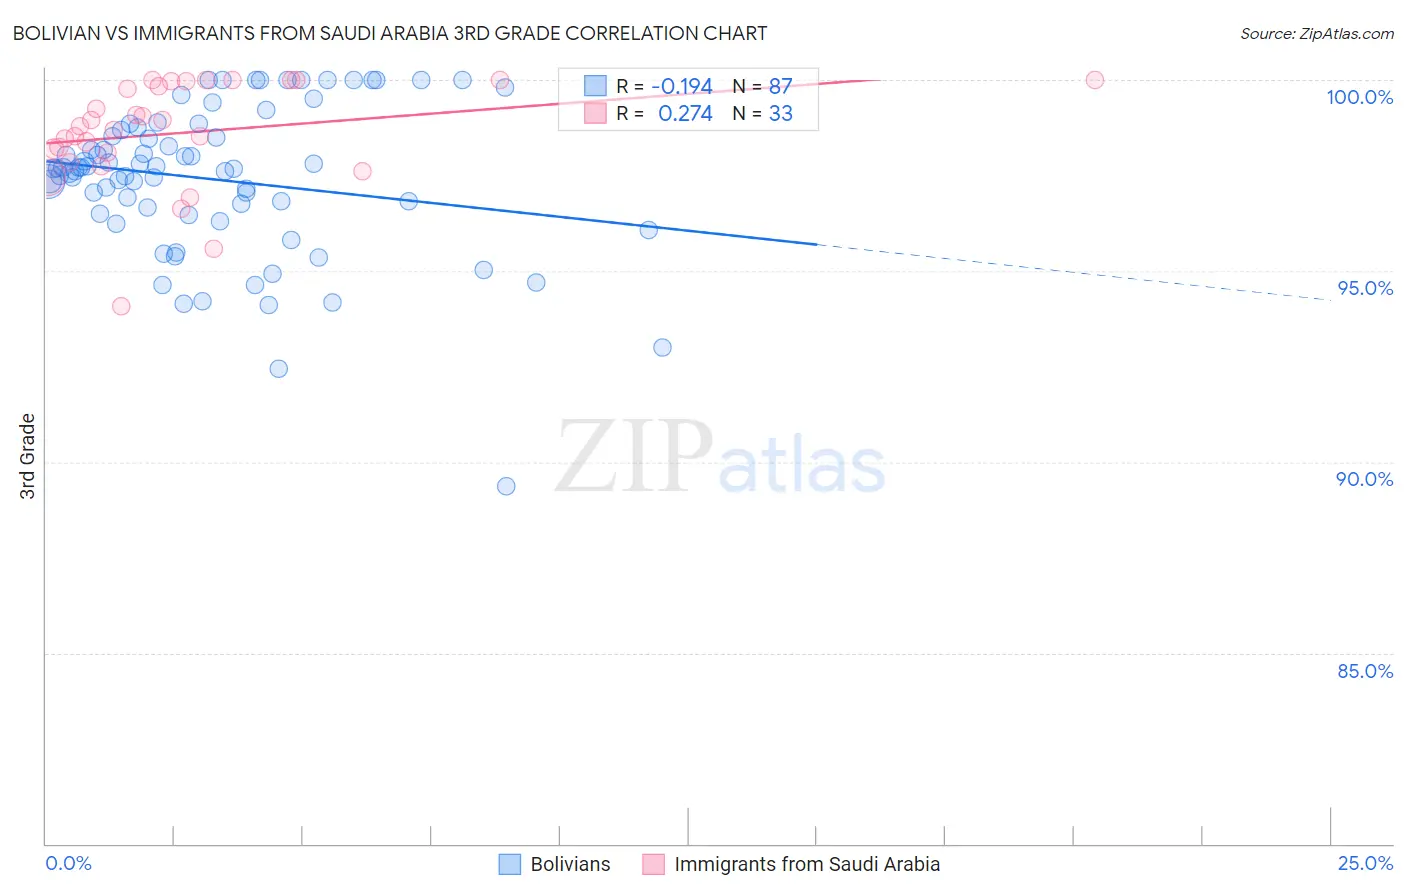
Bolivian vs Immigrants from Saudi Arabia 3rd Grade Correlation Chart
The statistical analysis conducted on geographies consisting of 184,667,361 people shows a poor negative correlation between the proportion of Bolivians and percentage of population with at least 3rd grade education in the United States with a correlation coefficient (R) of -0.194 and weighted average of 97.3%. Similarly, the statistical analysis conducted on geographies consisting of 164,277,573 people shows a weak positive correlation between the proportion of Immigrants from Saudi Arabia and percentage of population with at least 3rd grade education in the United States with a correlation coefficient (R) of 0.274 and weighted average of 98.0%, a difference of 0.66%.
3rd Grade Correlation Summary
| Measurement | Bolivian | Immigrants from Saudi Arabia |
| Minimum | 89.3% | 94.1% |
| Maximum | 100.0% | 100.0% |
| Range | 10.7% | 5.9% |
| Mean | 97.4% | 98.6% |
| Median | 97.7% | 98.8% |
| Interquartile 25% (IQ1) | 96.5% | 98.0% |
| Interquartile 75% (IQ3) | 98.7% | 100.0% |
| Interquartile Range (IQR) | 2.2% | 2.0% |
| Standard Deviation (Sample) | 2.0% | 1.4% |
| Standard Deviation (Population) | 2.0% | 1.4% |
Similar Demographics by 3rd Grade
Demographics Similar to Bolivians by 3rd Grade
In terms of 3rd grade, the demographic groups most similar to Bolivians are Immigrants from Congo (97.3%, a difference of 0.0%), Immigrants from Colombia (97.3%, a difference of 0.010%), Jamaican (97.4%, a difference of 0.020%), Immigrants from Liberia (97.3%, a difference of 0.020%), and Immigrants from Middle Africa (97.4%, a difference of 0.030%).
| Demographics | Rating | Rank | 3rd Grade |
| Immigrants | Eastern Africa | 0.9 /100 | #248 | Tragic 97.4% |
| South Americans | 0.9 /100 | #249 | Tragic 97.4% |
| Immigrants | Middle Africa | 0.9 /100 | #250 | Tragic 97.4% |
| Immigrants | Asia | 0.8 /100 | #251 | Tragic 97.4% |
| Peruvians | 0.8 /100 | #252 | Tragic 97.4% |
| Immigrants | Africa | 0.8 /100 | #253 | Tragic 97.4% |
| Jamaicans | 0.7 /100 | #254 | Tragic 97.4% |
| Bolivians | 0.6 /100 | #255 | Tragic 97.3% |
| Immigrants | Congo | 0.6 /100 | #256 | Tragic 97.3% |
| Immigrants | Colombia | 0.5 /100 | #257 | Tragic 97.3% |
| Immigrants | Liberia | 0.5 /100 | #258 | Tragic 97.3% |
| Armenians | 0.4 /100 | #259 | Tragic 97.3% |
| Immigrants | Ethiopia | 0.4 /100 | #260 | Tragic 97.3% |
| Immigrants | South America | 0.4 /100 | #261 | Tragic 97.3% |
| Immigrants | Sierra Leone | 0.4 /100 | #262 | Tragic 97.3% |
Demographics Similar to Immigrants from Saudi Arabia by 3rd Grade
In terms of 3rd grade, the demographic groups most similar to Immigrants from Saudi Arabia are Syrian (98.0%, a difference of 0.0%), Immigrants from Japan (98.0%, a difference of 0.0%), Immigrants from Zimbabwe (98.0%, a difference of 0.0%), Ute (98.0%, a difference of 0.0%), and Immigrants from Croatia (98.0%, a difference of 0.010%).
| Demographics | Rating | Rank | 3rd Grade |
| Iranians | 94.9 /100 | #118 | Exceptional 98.0% |
| Spanish | 94.8 /100 | #119 | Exceptional 98.0% |
| Immigrants | Croatia | 94.4 /100 | #120 | Exceptional 98.0% |
| Iroquois | 94.1 /100 | #121 | Exceptional 98.0% |
| Lebanese | 94.1 /100 | #122 | Exceptional 98.0% |
| Syrians | 93.8 /100 | #123 | Exceptional 98.0% |
| Immigrants | Japan | 93.7 /100 | #124 | Exceptional 98.0% |
| Immigrants | Saudi Arabia | 93.5 /100 | #125 | Exceptional 98.0% |
| Immigrants | Zimbabwe | 93.4 /100 | #126 | Exceptional 98.0% |
| Ute | 93.2 /100 | #127 | Exceptional 98.0% |
| Colville | 92.1 /100 | #128 | Exceptional 98.0% |
| Immigrants | Serbia | 91.9 /100 | #129 | Exceptional 98.0% |
| Immigrants | Europe | 91.2 /100 | #130 | Exceptional 98.0% |
| Immigrants | Bulgaria | 89.1 /100 | #131 | Excellent 97.9% |
| Immigrants | Hungary | 88.8 /100 | #132 | Excellent 97.9% |