Immigrants from Syria vs Osage No Schooling Completed

COMPARE

Immigrants from Syria
Race
Ancestry
AfghanAfricanAlaska NativeAlaskan AthabascanAlbanianAleutAlsatianAmericanApacheArabArapahoArgentineanArmenianAssyrian/Chaldean/SyriacAustralianAustrianBahamianBangladeshiBarbadianBasqueBelgianBelizeanBermudanBhutaneseBlackfeetBolivianBrazilianBritishBritish West IndianBulgarianBurmeseCajunCambodianCanadianCape VerdeanCarpatho RusynCelticCentral AmericanCentral American IndianCherokeeCheyenneChickasawChileanChineseChippewaChoctawColombianColvilleComancheCosta RicanCreeCreekCroatianCrowCubanCypriotCzechCzechoslovakianDanishDelawareDominicanDutchDutch West IndianEastern EuropeanEcuadorianEgyptianEnglishEstonianEthiopianEuropeanFijianFilipinoFinnishFrenchFrench American IndianFrench CanadianGermanGerman RussianGhanaianGreekGuamanian/ChamorroGuatemalanGuyaneseHaitianHmongHonduranHopiHoumaHungarianIcelanderIndian (Asian)IndonesianInupiatIranianIraqiIrishIroquoisIsraeliItalianJamaicanJapaneseJordanianKenyanKiowaKoreanLaotianLatvianLebaneseLiberianLithuanianLumbeeLuxembourgerMacedonianMalaysianMalteseMarshalleseMenomineeMexicanMexican American IndianMongolianMoroccanNative HawaiianNavajoNepaleseNew ZealanderNicaraguanNigerianNorthern EuropeanNorwegianOkinawanOttawaPaiutePakistaniPalestinianPanamanianParaguayanPennsylvania GermanPeruvianPimaPolishPortuguesePotawatomiPuebloPuerto RicanPuget Sound SalishRomanianRussianSalvadoranSamoanScandinavianScotch-IrishScottishSeminoleSenegaleseSerbianShoshoneSierra LeoneanSiouxSlavicSlovakSloveneSomaliSouth AfricanSouth AmericanSouth American IndianSoviet UnionSpaniardSpanishSpanish AmericanSpanish American IndianSri LankanSubsaharan AfricanSudaneseSwedishSwissSyrianTaiwaneseThaiTlingit-HaidaTohono O'OdhamTonganTrinidadian and TobagonianTsimshianTurkishU.S. Virgin IslanderUgandanUkrainianUruguayanUteVenezuelanVietnameseWelshWest IndianYakamaYaquiYugoslavianYumanYup'ikZimbabwean
Immigration
NonimmigrantsImmigrantsAfghanistanAfricaAlbaniaArgentinaArmeniaAsiaAustraliaAustriaBahamasBangladeshBarbadosBelarusBelgiumBelizeBoliviaBosnia and HerzegovinaBrazilBulgariaBurma/MyanmarCabo VerdeCambodiaCameroonCanadaCaribbeanCentral AmericaChileChinaColombiaCongoCosta RicaCroatiaCubaCzechoslovakiaDenmarkDominicaDominican RepublicEastern AfricaEastern AsiaEastern EuropeEcuadorEgyptEl SalvadorEnglandEritreaEthiopiaEuropeFijiFranceGermanyGhanaGreeceGrenadaGuatemalaGuyanaHaitiHondurasHong KongHungaryIndiaIndonesiaIranIraqIrelandIsraelItalyJamaicaJapanJordanKazakhstanKenyaKoreaKuwaitLaosLatin AmericaLatviaLebanonLiberiaLithuaniaMalaysiaMexicoMicronesiaMiddle AfricaMoldovaMoroccoNepalNetherlandsNicaraguaNigeriaNorth AmericaNorth MacedoniaNorthern AfricaNorthern EuropeNorwayOceaniaPakistanPanamaPeruPhilippinesPolandPortugalRomaniaRussiaSaudi ArabiaScotlandSenegalSerbiaSierra LeoneSingaporeSomaliaSouth AfricaSouth AmericaSouth Central AsiaSouth Eastern AsiaSouthern EuropeSpainSri LankaSt. Vincent and the GrenadinesSudanSwedenSwitzerlandSyriaTaiwanThailandTrinidad and TobagoTurkeyUgandaUkraineUruguayUzbekistanVenezuelaVietnamWest IndiesWestern AfricaWestern AsiaWestern EuropeYemenZaireZimbabweAzores
Osage
Race
Ancestry
AfghanAfricanAlaska NativeAlaskan AthabascanAlbanianAleutAlsatianAmericanApacheArabArapahoArgentineanArmenianAssyrian/Chaldean/SyriacAustralianAustrianBahamianBangladeshiBarbadianBasqueBelgianBelizeanBermudanBhutaneseBlackfeetBolivianBrazilianBritishBritish West IndianBulgarianBurmeseCajunCambodianCanadianCape VerdeanCarpatho RusynCelticCentral AmericanCentral American IndianCherokeeCheyenneChickasawChileanChineseChippewaChoctawColombianColvilleComancheCosta RicanCreeCreekCroatianCrowCubanCypriotCzechCzechoslovakianDanishDelawareDominicanDutchDutch West IndianEastern EuropeanEcuadorianEgyptianEnglishEstonianEthiopianEuropeanFijianFilipinoFinnishFrenchFrench American IndianFrench CanadianGermanGerman RussianGhanaianGreekGuamanian/ChamorroGuatemalanGuyaneseHaitianHmongHonduranHopiHoumaHungarianIcelanderIndian (Asian)IndonesianInupiatIranianIraqiIrishIroquoisIsraeliItalianJamaicanJapaneseJordanianKenyanKiowaKoreanLaotianLatvianLebaneseLiberianLithuanianLumbeeLuxembourgerMacedonianMalaysianMalteseMarshalleseMenomineeMexicanMexican American IndianMongolianMoroccanNative HawaiianNavajoNepaleseNew ZealanderNicaraguanNigerianNorthern EuropeanNorwegianOkinawanOsageOttawaPaiutePakistaniPalestinianPanamanianParaguayanPennsylvania GermanPeruvianPimaPolishPortuguesePotawatomiPuebloPuerto RicanPuget Sound SalishRomanianRussianSalvadoranSamoanScandinavianScotch-IrishScottishSeminoleSenegaleseSerbianShoshoneSierra LeoneanSiouxSlavicSlovakSloveneSomaliSouth AfricanSouth AmericanSouth American IndianSoviet UnionSpaniardSpanishSpanish AmericanSpanish American IndianSri LankanSubsaharan AfricanSudaneseSwedishSwissSyrianTaiwaneseThaiTlingit-HaidaTohono O'OdhamTonganTrinidadian and TobagonianTsimshianTurkishU.S. Virgin IslanderUgandanUkrainianUruguayanUteVenezuelanVietnameseWelshWest IndianYakamaYaquiYugoslavianYumanYup'ikZimbabwean
Immigration
NonimmigrantsImmigrantsAfghanistanAfricaAlbaniaArgentinaArmeniaAsiaAustraliaAustriaBahamasBangladeshBarbadosBelarusBelgiumBelizeBoliviaBosnia and HerzegovinaBrazilBulgariaBurma/MyanmarCabo VerdeCambodiaCameroonCanadaCaribbeanCentral AmericaChileChinaColombiaCongoCosta RicaCroatiaCubaCzechoslovakiaDenmarkDominicaDominican RepublicEastern AfricaEastern AsiaEastern EuropeEcuadorEgyptEl SalvadorEnglandEritreaEthiopiaEuropeFijiFranceGermanyGhanaGreeceGrenadaGuatemalaGuyanaHaitiHondurasHong KongHungaryIndiaIndonesiaIranIraqIrelandIsraelItalyJamaicaJapanJordanKazakhstanKenyaKoreaKuwaitLaosLatin AmericaLatviaLebanonLiberiaLithuaniaMalaysiaMexicoMicronesiaMiddle AfricaMoldovaMoroccoNepalNetherlandsNicaraguaNigeriaNorth AmericaNorth MacedoniaNorthern AfricaNorthern EuropeNorwayOceaniaPakistanPanamaPeruPhilippinesPolandPortugalRomaniaRussiaSaudi ArabiaScotlandSenegalSerbiaSierra LeoneSingaporeSomaliaSouth AfricaSouth AmericaSouth Central AsiaSouth Eastern AsiaSouthern EuropeSpainSri LankaSt. Vincent and the GrenadinesSudanSwedenSwitzerlandTaiwanThailandTrinidad and TobagoTurkeyUgandaUkraineUruguayUzbekistanVenezuelaVietnamWest IndiesWestern AfricaWestern AsiaWestern EuropeYemenZaireZimbabweAzores
No Schooling Completed
Income
Poverty
Unemployment
Labor Participation
Family Structure
Vehicle Availability
Education Level
Disability

No Schooling Completed Comparison

Immigrants from Syria

Osage

Tragic
Exceptional
2.3%
NO SCHOOLING COMPLETED
6.6/ 100
METRIC RATING
217th/ 347
METRIC RANK
1.8%
NO SCHOOLING COMPLETED
99.2/ 100
METRIC RATING
87th/ 347
METRIC RANK

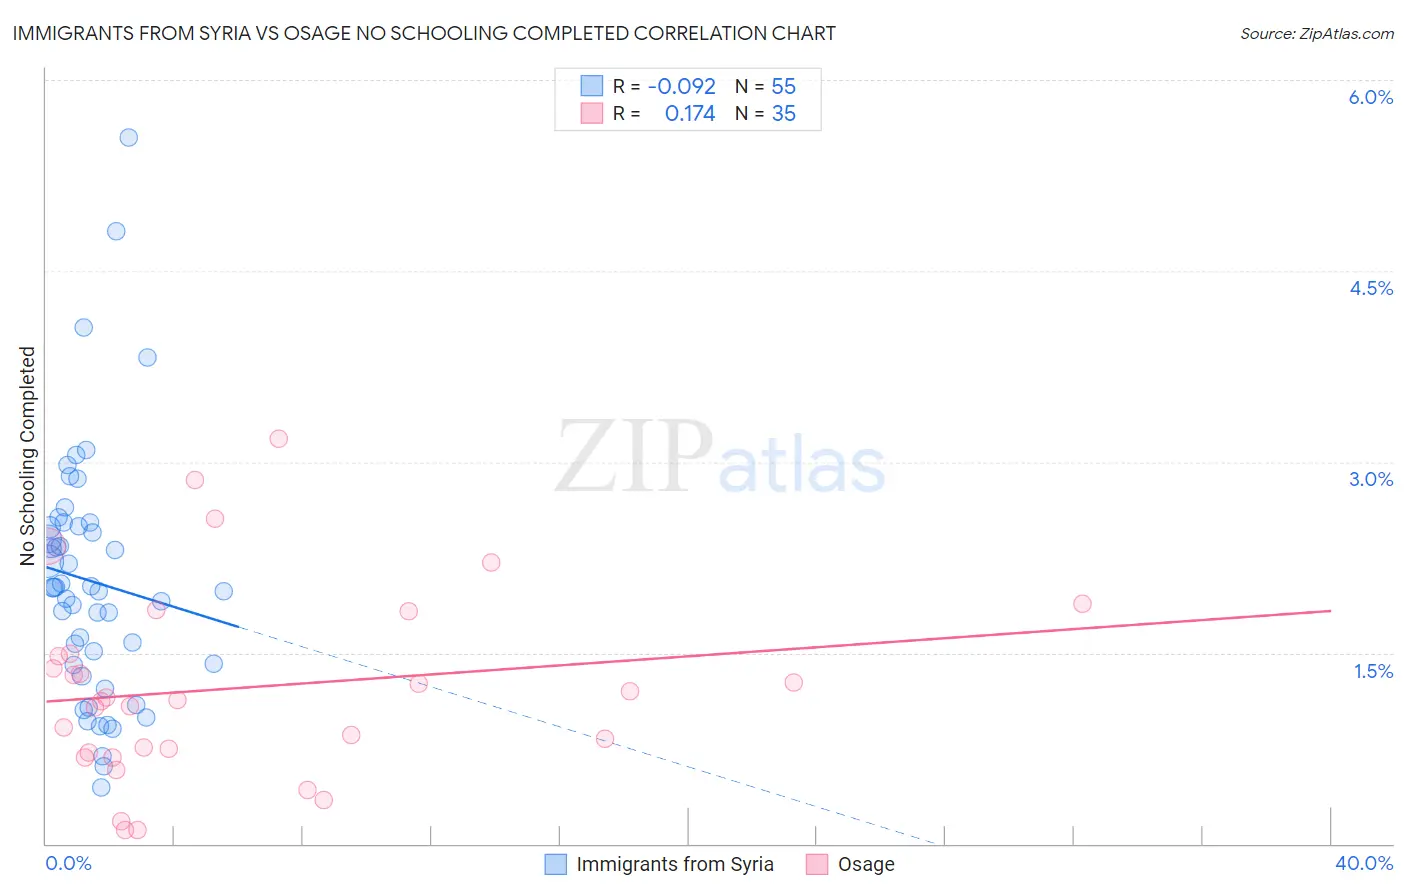
Immigrants from Syria vs Osage No Schooling Completed Correlation Chart

The statistical analysis conducted on geographies consisting of 173,620,316 people shows a slight negative correlation between the proportion of Immigrants from Syria and percentage of population with no schooling in the United States with a correlation coefficient (R) of -0.092 and weighted average of 2.3%. Similarly, the statistical analysis conducted on geographies consisting of 91,503,945 people shows a poor positive correlation between the proportion of Osage and percentage of population with no schooling in the United States with a correlation coefficient (R) of 0.174 and weighted average of 1.8%, a difference of 29.7%.
Immigrants from Syria vs Osage No Schooling Completed

No Schooling Completed Correlation Summary

MeasurementImmigrants from SyriaOsage
Minimum0.44%0.10%
Maximum5.6%3.2%
Range5.1%3.1%
Mean2.1%1.2%
Median2.0%1.1%
Interquartile 25% (IQ1)1.4%0.71%
Interquartile 75% (IQ3)2.5%1.5%
Interquartile Range (IQR)1.1%0.78%
Standard Deviation (Sample)0.98%0.75%
Standard Deviation (Population)0.97%0.74%

Similar Demographics by No Schooling Completed

Demographics Similar to Immigrants from Syria by No Schooling Completed

In terms of no schooling completed, the demographic groups most similar to Immigrants from Syria are Tongan (2.3%, a difference of 0.090%), Immigrants from Nepal (2.3%, a difference of 0.11%), Immigrants from Zaire (2.3%, a difference of 0.28%), Senegalese (2.3%, a difference of 0.55%), and Samoan (2.3%, a difference of 0.72%).
DemographicsRating | RankNo Schooling Completed
Natives/Alaskans
10.0
/100
|
#210
Tragic
2.2%
Immigrants | Panama
8.8
/100
|
#211
Tragic
2.3%
Immigrants | Morocco
8.7
/100
|
#212
Tragic
2.3%
Ute
8.2
/100
|
#213
Tragic
2.3%
Samoans
8.2
/100
|
#214
Tragic
2.3%
Immigrants | Zaire
7.2
/100
|
#215
Tragic
2.3%
Tongans
6.8
/100
|
#216
Tragic
2.3%
Immigrants | Syria
6.6
/100
|
#217
Tragic
2.3%
Immigrants | Nepal
6.4
/100
|
#218
Tragic
2.3%
Senegalese
5.6
/100
|
#219
Tragic
2.3%
Immigrants | Costa Rica
5.1
/100
|
#220
Tragic
2.3%
Immigrants | Sudan
5.0
/100
|
#221
Tragic
2.3%
Sub-Saharan Africans
4.7
/100
|
#222
Tragic
2.3%
Immigrants | Lebanon
4.5
/100
|
#223
Tragic
2.3%
Tohono O'odham
4.1
/100
|
#224
Tragic
2.3%

Demographics Similar to Osage by No Schooling Completed

In terms of no schooling completed, the demographic groups most similar to Osage are Immigrants from Western Europe (1.8%, a difference of 0.040%), South African (1.8%, a difference of 0.080%), Ukrainian (1.8%, a difference of 0.32%), Immigrants from Australia (1.7%, a difference of 0.37%), and Immigrants from Denmark (1.7%, a difference of 0.41%).
DemographicsRating | RankNo Schooling Completed
Cypriots
99.3
/100
|
#80
Exceptional
1.7%
Icelanders
99.3
/100
|
#81
Exceptional
1.7%
Immigrants | South Africa
99.3
/100
|
#82
Exceptional
1.7%
Potawatomi
99.3
/100
|
#83
Exceptional
1.7%
Immigrants | Denmark
99.2
/100
|
#84
Exceptional
1.7%
Immigrants | Australia
99.2
/100
|
#85
Exceptional
1.7%
Ukrainians
99.2
/100
|
#86
Exceptional
1.8%
Osage
99.2
/100
|
#87
Exceptional
1.8%
Immigrants | Western Europe
99.2
/100
|
#88
Exceptional
1.8%
South Africans
99.1
/100
|
#89
Exceptional
1.8%
Sioux
99.0
/100
|
#90
Exceptional
1.8%
Immigrants | Germany
99.0
/100
|
#91
Exceptional
1.8%
Romanians
98.8
/100
|
#92
Exceptional
1.8%
Turks
98.7
/100
|
#93
Exceptional
1.8%
Immigrants | Nonimmigrants
98.5
/100
|
#94
Exceptional
1.8%